+86 13638632902
 Jason@cleanroomequips.com


 MENU

Introduction
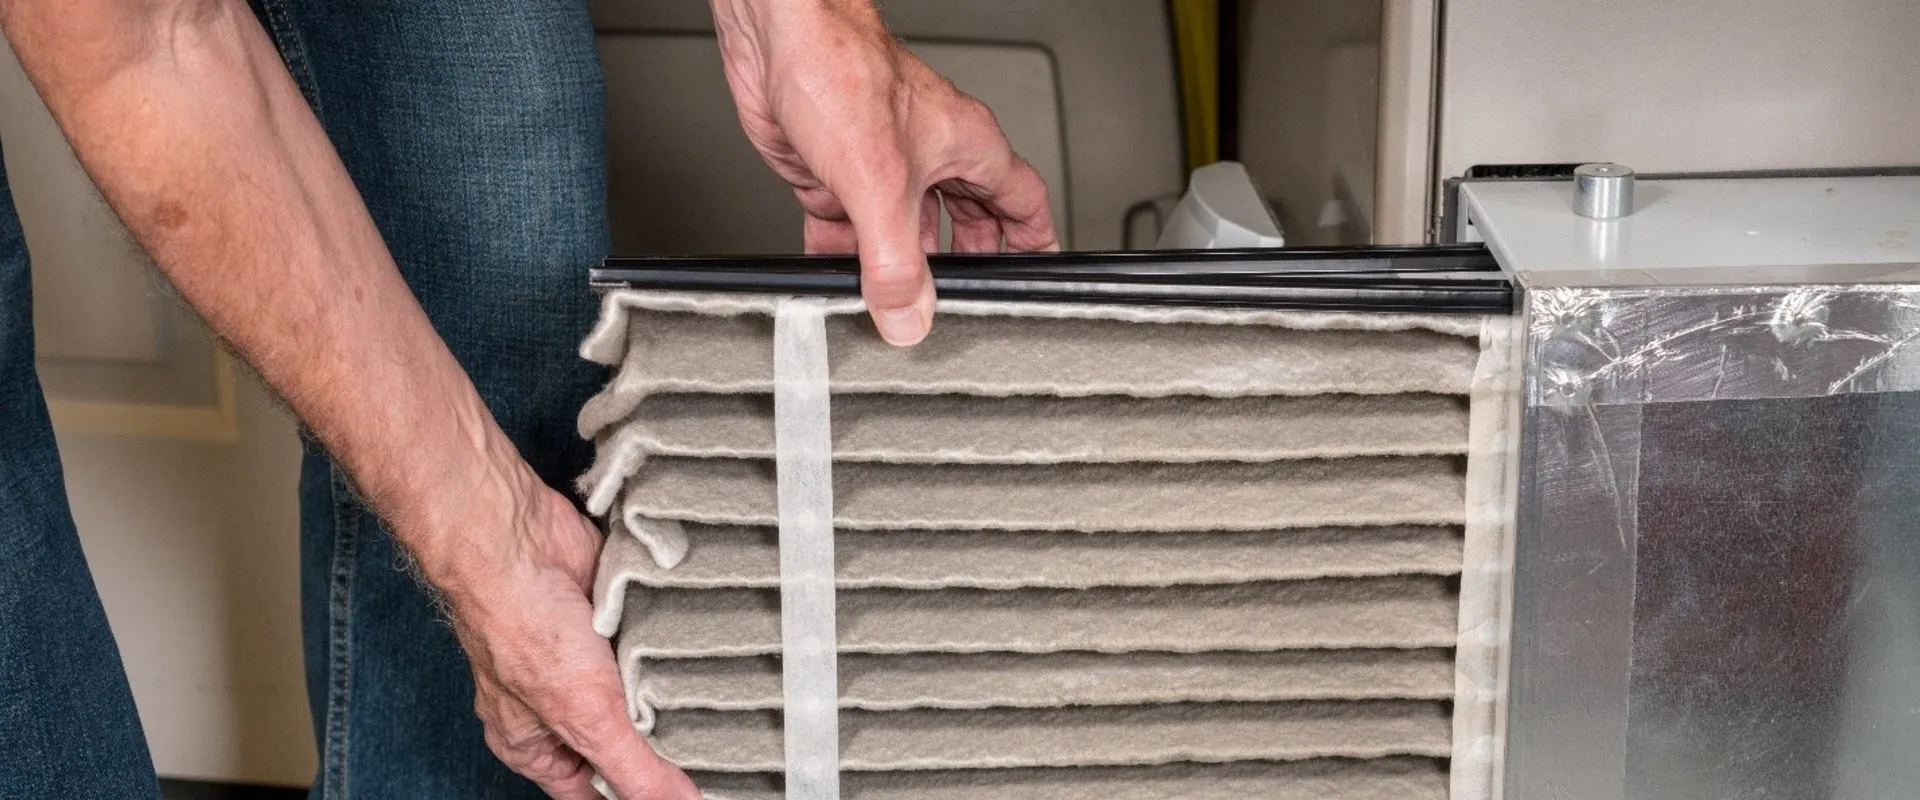
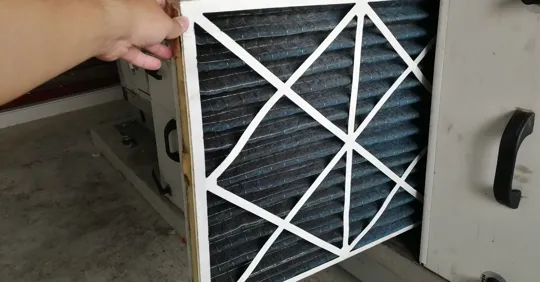
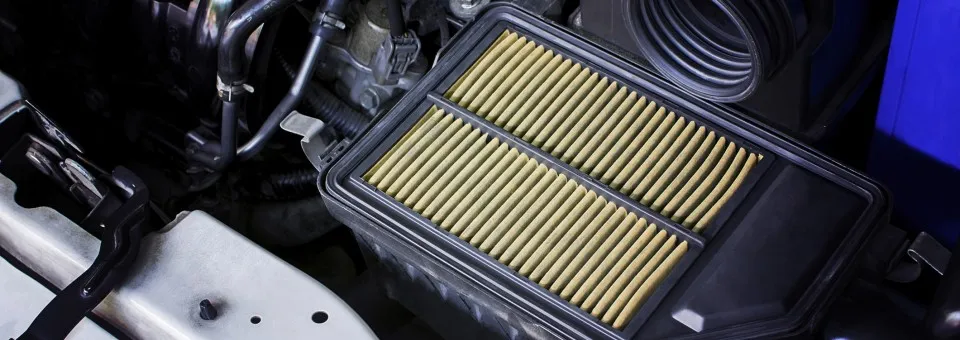
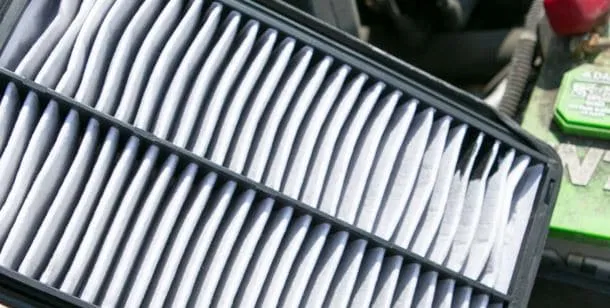
air filters have an impact on indoor air quality by filtering out contaminants from air distributed throughout any building.
The degree to which the filter works is dependent on a number of variables including its efficiency of capture, installation, seal integrity, and the frequency of maintenance or replacement. That is why the relationship between air filters and indoor air quality is never a single number.
This article discusses the particle capture process, explains the classification of performance based on standards such as EN 1822 and ISO 16890, and shows how air filters improve indoor air quality in practice.
The information provided will include HVAC air filters for commercial buildings and cleanroom air filters for pharmaceutical, semiconductor, and laboratory operations. Deiiang examples will be used to help follow the performance data provided within the catalog.
How air filters affect indoor air quality
There is a direct relationship between the air filter process and indoor air quality. How air filters improve indoor air quality comes down to a few measurable factors. Air that is contaminated enters the filter media, particles are deposited on or within the fibers, and filtered air enters the indoor environment.
A filter creates cleaner air by filtering out particles that exist in that space. This is significant because filtration addresses a particular type of indoor contaminant. Particulate matter like dust, pollen, bacteria, smoke, and industrial mists can be separated using mechanical or electrostatic means, and this is the basis of indoor particle removal in any occupied space.
Gas contaminants like volatile organic compounds and carbon monoxide require other methods, usually activated carbon or chemisorbent materials. The manner through which air filters improve indoor air quality can be summarized simply: return or outside air enters carrying particles; pre-filters trap larger debris; high-efficiency filters trap smaller and ultrafine particles; clean supply air enters the room; and remaining pollution is exhausted through return channels.
The efficiency of a filter applied to a single air passage differs from room-level efficiency. For a room of 300 m³ supplied with 2,500 m³/h of air, including 500 m³/h outside air and 2,000 m³/h recirculated air, a vent can have 99% single-pass efficiency.
If 5% of the air skips the vent due to frame leakage, the effective efficiency falls to about 94%. Other factors also relate to the concentration of particles in the room, such as the level of contamination, the air exchange rate, and mixing. It is impossible to provide precise predictions without information about those factors.
From airborne particles to cleaner supply air
Air handling systems move air in a continuous loop. Return air from the occupied space, mixed with outdoor ventilation air, passes through a filter bank before being conditioned and supplied back to the room. The filter intercepts particles along this pathway.
The diagram shows how return air passes through the filter and out to the supply point. Bypass points are identified; these could include leaks in filter frames, defective gaskets, and poor sealing of case connections. They represent points where unfiltered air can be reintroduced into the airflow.
Thus, indoor particle removal depends as much on the elimination of bypass points as on the filtration performance rating. Using ASHRAE Standard 52.2-2017, a MERV 13 filter must have a minimum composite average particle size efficiency of 50% for particles from 0.3 to 1.0 µm, 85% from 1.0 to 3.0 µm, and 90% from 3.0 to 10.0 µm [6].
These limits define minimum classification levels; they do not guarantee any actual products will perform according to these parameters once installed. If 10% of air leaks around the filter, then system efficiency depends on how the leaked air mixes with the filtered air before arriving inside a building.
If mixing were perfect, the efficiency would be around 0.9 times the filter efficiency. If mixing does not occur, localized particle concentrations around the bypass could be higher.
What filtration can and cannot control
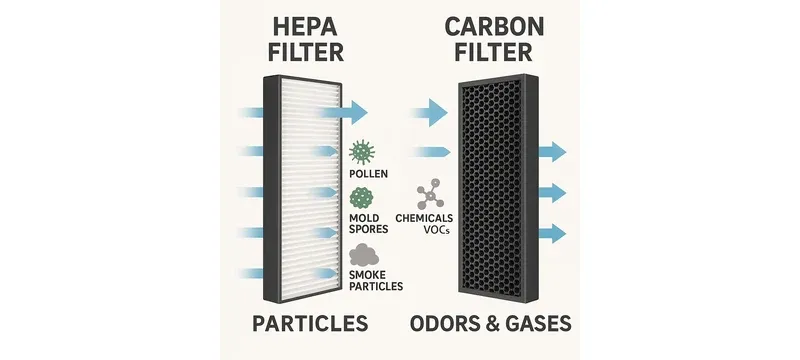
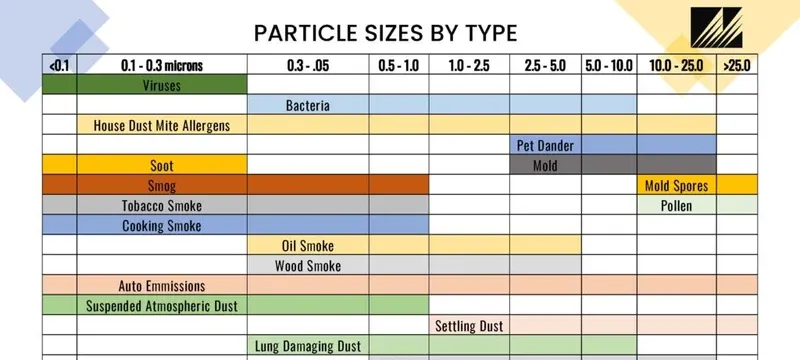
A filter’s rating for indoor particle removal tells nothing about its ability to eliminate gases unless there is a sorbent material in the filtering system.
The matrix classifies pollutants based on particle sizes and airborne contaminants and displays the filtration technology suitable for eACH type. The matrix does not display quantitative values; it is designed to show which pollutants have to be filtered in which way.
Pollutants are classified according to their nature. Mechanical or electrostatic filtration is used for particulate matter. Some gases, such as volatile organic compounds, ozone, SOx, and NOx, require adsorption or chemisorption.
Activated carbon is efficient at removing many organic vapors and solvents whose molecular weight exceeds 50 and boiling point is lower than 120 degrees Fahrenheit. Other sorbent combinations are necessary for gases that standard carbon handles poorly. Effectiveness depends on chemical composition, contact time, concentration, humidity, and service life.
Adsorption is the process where gas molecules stick to the surface of a porous adsorbent. Chemisorption is a chemical reaction with an impregnated adsorbent. Adsorption may be restored under certain conditions, while chemisorption is generally one-way.
Smelling odor does not indicate the absence of hazardous gases. A filter may reduce odors, which makes people think there are no harmful gases present. The pollutant, capacity, and monitoring plan must dictate the gas-media replacement schedule rather than the particle filter’s pressure-drop trigger.
Carbon monoxide and radon cannot be reliably controlled by filtration. Carbon monoxide requires control at the source with combustion appliance maintenance and ventilation; radon requires soil depressurization or other mitigation. These limitations do not diminish the utility of air filters; they define the limits of reliable particle filtration.
Particle capture mechanisms and performance
The particle capture mechanisms of filter media operate in conjunction with one another in many cases. The dominant mechanism depends on particle properties, fiber dimensions, and airflow through the filter. Understanding these mechanisms explains why filter efficiency varies with particle size, and they are the physical basis of the link between air filters and indoor air quality.
Interception, impaction, diffusion, and electrostatic effects may all function simultaneously. Their importance is based on filter characteristics and operating velocity. Under some circumstances, one mechanism will dominate in a given filter, but a single mechanism will not control overall performance.
Table 1: Comparison of particle capture mechanisms in fibrous filter media.
| Mechanism | Typical Target Particles | Operating Considerations |
|---|---|---|
| Interception | Approx. 0.1–1 µm | Particle follows airflow but contacts fiber surface |
| Impaction | Approx. >0.3 µm | Particle inertia causes deviation from streamline |
| Diffusion | Approx. <0.1 µm | Brownian motion increases fiber contact probability |
| Electrostatic attraction | Approx. 0.01–1 µm | Enhanced capture; charge dissipation reduces effect over time |
| Mechanism | Typical Target Particles |
|---|---|
| Interception | Approx. 0.1–1 µm |
| Impaction | Approx. >0.3 µm |
| Diffusion | Approx. <0.1 µm |
| Electrostatic attraction | Approx. 0.01–1 µm |
Mechanical capture — interception, impaction, and diffusion — relies on no electrostatic charge and thus provides more constant efficiency during the filter’s life. Electrostatic media can provide better initial performance at lower pressure drop, but captured particles gradually neutralize the charge.
How filter media capture particles
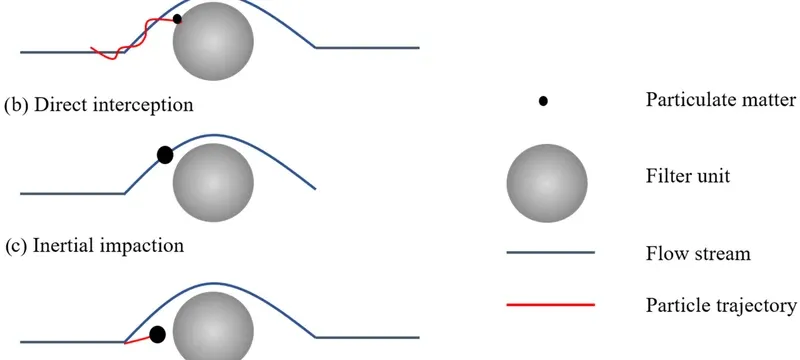
A fibrous medium consists of unsystematically arranged fibers, which results in complicated passages for air. Particles present in the air stream are trapped due to contact with fiber surfaces.
Interception occurs when a particle follows the streamline but is close enough to a fiber that its radius touches the fiber. Impaction is the point when, due to inertia, the particle cannot follow the bending streamline and strikes the fiber.
Diffusion occurs for very small particles, under about 0.1 µm, due to Brownian motion and their contact with fibers. For particles greater than approximately 0.3 µm, inertial impaction and direct interception become significant. As particles get smaller than about 0.1 µm, diffusion becomes more significant.
Reading efficiency claims and test results
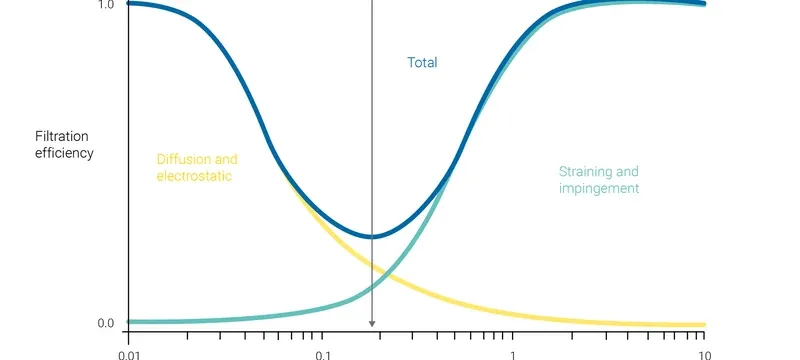
Filter efficiency data are unhelpful if they do not specify the test aerosol, particle size, and test conditions. A filter rated at 99.97% efficiency for 0.3 µm particles can have different performance ratings at other particle sizes.
The graph specifies efficiency ratings based on particle diameter. The curve dips to the point of minimum fractional efficiency at the MPPS and moves upward on both sides. According to EN 1822:2019, the MPPS can be determined using the methodology for filtration performance evaluation, which varies by filter and test conditions [1].
The universal MPPS range of 0.1–0.2 µm is not technically defensible because that value is determined by media characteristics and face velocity. The MPPS, the efficiency at a given size like 0.3 µm, and an overall classification are three separate issues.
For a filter to be classified as H13 under EN 1822:2019, it must have an MPPS efficiency of at least 99.95%. An efficiency of 99.97% at 0.3 µm cannot be presumed to automatically qualify it as an H13 filter [1].
Initial efficiency, taken from a brand new unused filter, will not necessarily reflect installed performance, since sealing, airflow circulation, and loading can all play a role. A laboratory efficiency curve will not determine the concentration at a point in the room or indicate how well the filter will work at the installed location.
Therefore, the term efficiency should be accompanied by terms indicating whether laboratory, factory, or installed results are being analyzed.
HVAC filters, ratings, and system selection
HVAC systems have different classifications around the world, which is why the link between air filters and indoor air quality depends on the standard being used. In North America, ASHRAE 52.2-2017 is used, which provides the air filter MERV rating, short for minimum efficiency reporting value, and the corresponding particle size ranges: 0.3–1.0 µm, 1.0–3.0 µm, and 3.0–10.0 µm [6].
In Europe, the same role for HVAC air filters was once played by EN 779, now replaced by ISO 16890, which calculates removal efficiency for PM1, PM2.5, and PM10 [5][9]. Table 2 compares the systems and shows their methodologies and applications.
Table 2: Comparison of filter rating systems with their test bases and application contexts.
| Rating System | Classification or Rating | Test Basis | Selection Use and Limitations |
|---|---|---|---|
| ASHRAE 52.2-2017 | MERV 1–16 | Minimum composite average PSE at 0.3–1.0 µm, 1.0–3.0 µm, 3.0–10.0 µm | North American HVAC selection; differs from ISO 16890 test conditions |
| EN 779 (withdrawn, 2012) | G1–G4, F5–F9 | Arrestance and average efficiency at 0.4 µm | Legacy reference; superseded by ISO 16890 for general ventilation |
| ISO 16890-1:2016 | ISO ePM1, ePM2.5, ePM10 | Fractional efficiency weighted to ambient aerosol distribution | Current global general ventilation standard; not applicable to HEPA/ULPA |
| EN 1822:2019 / ISO 29463 | E10–E12, H13–H14, U15–U17 | Efficiency at MPPS | HEPA/ULPA classification; differs from general ventilation standards |
| Rating System | Classification | Test Basis |
|---|---|---|
| ASHRAE 52.2-2017 | MERV 1–16 | Minimum composite average PSE at three size ranges |
| EN 779 (withdrawn, 2012) | G1–G4, F5–F9 | Arrestance and average efficiency at 0.4 µm |
| ISO 16890-1:2016 | ISO ePM1, ePM2.5, ePM10 | Fractional efficiency weighted to ambient aerosol |
| EN 1822:2019 / ISO 29463 | E10–E12, H13–H14, U15–U17 | Efficiency at MPPS |
The air filter MERV rating tells a building operator the minimum particle removal efficiency under ASHRAE Standard 52.2-2017 test conditions. A MERV 13 filter must have at least 50% efficiency for 0.3–1.0 µm particles, at least 85% for 1.0–3.0 µm, and at least 90% for 3.0–10.0 µm [6]. The rating does not predict installed performance or bypass leakage.
Choosing HVAC air filters for a building
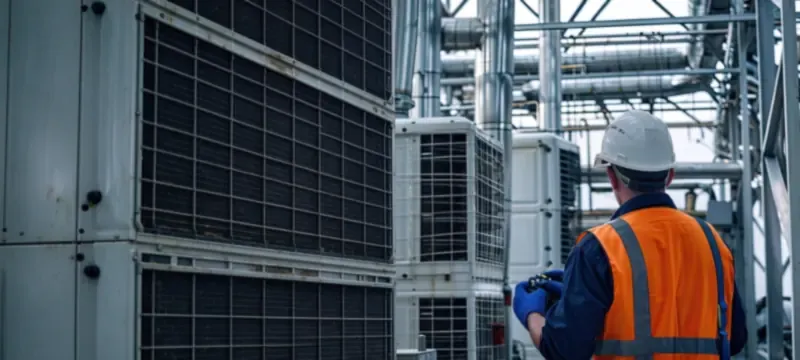
Filter selection depends on desired air quality levels and the capabilities of the air handling system, and it is one of the main levers for how air filters improve indoor air quality. More efficient filters capture more particles but also have greater resistance to airflow.
This selection sequence for HVAC air filters begins with the function of the building. Various inputs influence any calculation of the efficiency range: required particle control, outdoor-air fraction, fan capacity, existing filtration stages, housing dimensions, and any health or process specifications.
In general, the air filter MERV rating guides most commercial premises toward MERV 8–11 or ISO ePM10 50%–ePM1 50% filters in the primary stage. Medical, pharmaceutical, and electronic facilities may use MERV 11–13 or ISO ePM1 50%–ePM1 80% as pre-filters ahead of HEPA filtration.
One important constraint is fan capacity. With initial resistance of 150 Pa, a filter works effectively when clean. When final resistance reaches 400 Pa, the fan must deliver consistent airflow through that resistance range.
Deiiang has a medium-efficiency range of glass fibre and synthetic bag filters with F5–F9 ratings in the legacy EN 779 classification. Catalogue data for the 592×592×381 mm 6-bag model lists airflow of 2,050 m³/h, 3.18 m² media area, initial resistance below 50 Pa (F5) to below 100 Pa (F8), and final resistance of 250–400 Pa.
An example selection, with inputs labelled, illustrates the process. A room of 500 m³ needs 2,000 m³/h supply air, consisting of 400 m³/h outdoor air and 1,600 m³/h recirculated air. The fan can provide 2,000 m³/h at 400 Pa total pressure.
A filter with initial resistance of 200 Pa and final resistance of 500 Pa would exceed the fan’s capacity at end of life. A filter with initial resistance of 150 Pa and final resistance of 350 Pa would be acceptable. These are illustrative assumptions.
Comparing MERV, EN 779, and HEPA classifications
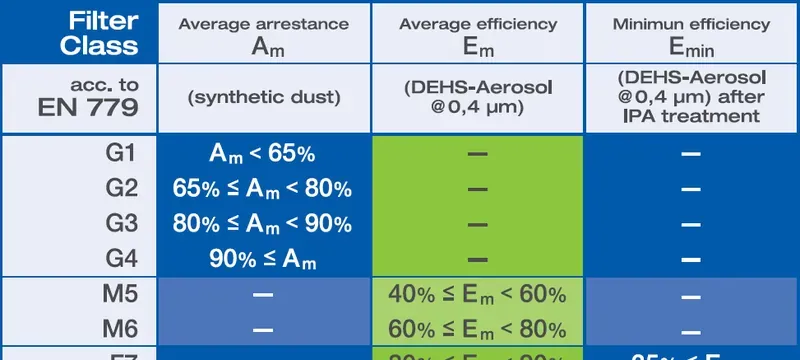
An air filter MERV rating and an EN 779 classification cannot be substituted directly for each other because they use different test aerosols, particle size ranges, and loading procedures.
The crosswalk graphic provides MERV, EN 779, ISO 16890, and EN 1822 classes while indicating that those classifications cannot be applied interchangeably. The graphic illustrates approximate relationships between systems of classification.
For example, EN 779 Class F7 indicates 80–85% efficiency at 0.4 µm but does not indicate a specific MERV rating unless tested. No assumption should be made that direct equivalence exists between systems without test data indicating comparable performance on the same aerosol and particle size range.
HEPA filters and cleanroom performance
HEPA filter efficiency is defined by a filter’s ability to remove particles at the Most Penetrating Particle Size using the classification system defined in EN 1822:2019 and ISO 29463 [1][2]. ULPA filters extend this range to U15–U17, meaning efficiencies from ≥99.9995% to ≥99.999995%.
Table 3 shows HEPA and ULPA classifications. A filter grade does not mean classification of a room.
Table 3: HEPA and ULPA filter classifications with possible application contexts.
| Filter Class | Applicable Standard | Test or Classification Basis | Possible Application Context — Not a Class Guarantee |
|---|---|---|---|
| H13 | EN 1822:2019 / ISO 29463 | ≥99.95% at MPPS | ISO 7–8 cleanrooms, pharmaceutical background |
| H14 | EN 1822:2019 / ISO 29463 | ≥99.995% at MPPS | iso 5–6 cleanrooms, aseptic processing |
| U15 | EN 1822:2019 / ISO 29463 | ≥99.9995% at MPPS | ISO 4–5 cleanrooms, semiconductor |
| U16 | EN 1822:2019 / ISO 29463 | ≥99.99995% at MPPS | ISO 3–4 cleanrooms, ultra-clean labs |
| U17 | EN 1822:2019 / ISO 29463 | ≥99.999995% at MPPS | ISO 1–3 cleanrooms, critical semiconductor |
| Filter Class | Applicable Standard | Test Basis |
|---|---|---|
| H13 | EN 1822:2019 / ISO 29463 | ≥99.95% at MPPS |
| H14 | EN 1822:2019 / ISO 29463 | ≥99.995% at MPPS |
| U15 | EN 1822:2019 / ISO 29463 | ≥99.9995% at MPPS |
| U16 | EN 1822:2019 / ISO 29463 | ≥99.99995% at MPPS |
| U17 | EN 1822:2019 / ISO 29463 | ≥99.999995% at MPPS |
Deiiang’s Combined High Efficiency Filter has H13 and H14 versions in accordance with EN 1822. Catalogue information indicates filtration efficiency of 99.97–99.99% for H13 and 99.995–99.999% for H14 at 0.3 µm. These are manufacturer figures, not independently verified performance.
EN 1822 classification is granted based on MPPS rating, which differs from efficiency at 0.3 µm. The 592×592×292 mm filter with 4 pleats delivers 2,500 m³/h at initial resistance ≤220 Pa for H14 and ≤200 Pa for H13, with 20.04 m² filter area. Catalogue dust-holding capacity is approximately 1,200 g.
Each filter is tested before shipping; the specification for test method and acceptance criteria must be checked against the appropriate datasheet.
HEPA filter efficiency and verification
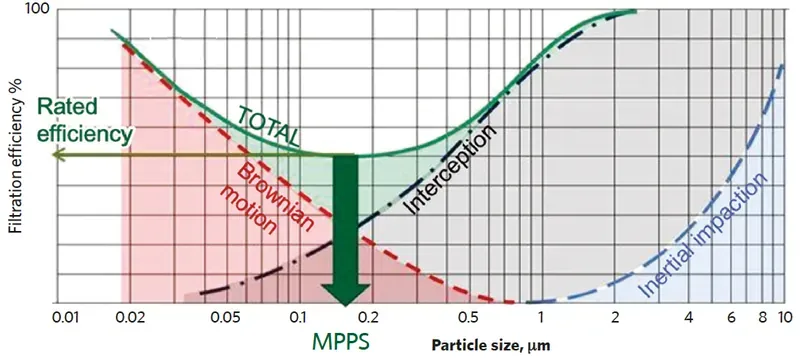
HEPA filter efficiency can be established through two different processes: element characterization and on-site filter integrity checks. Factory element testing and on-site installed-filter leak testing are distinct activities.
The diagram here presents HEPA filter efficiency curves across the particle-size range. The MPPS minimum is included on all efficiency curves. The MPPS efficiency of a filter element can only be determined through factory testing as defined in EN 1822-1:2019 [1].
Specific standards for on-site filter testing are defined in ISO 29463-4:2011 and ISO 29463-5:2022 [3][4]. Factory element testing measures filter efficiency at the MPPS on an entire HEPA filter element. On-site testing verifies the integrity of the installed filter, frames, and seals in the filter housing.
iso 14644-3:2019 defines on-site testing metrics [8]. Both element testing and on-site filter testing are usually required for cleanroom certification. The specific requirements vary based on project specifications and governing regulations.
The suitable aerosol and procedures used for testing are based on the protocol documentation. PAO and DOP are not suitable interchangeable choices for every installation.
Selecting cleanroom air filters by application
Selection of cleanroom air filters is based on process risks and design criteria; cleanroom air quality is not fixed by particle size alone. Pharmaceutical aseptic filling areas may need H14 terminal filters, but the filter grade depends on the contamination control approach and validated acceptance criteria.
The schematic illustrates how cleanroom air filters are staged, from outdoor air intake through pre-filtration and main filtration to the terminal HEPA filter at the ceiling. Deiiang’s DOP Integrated Filter is intended for cleanrooms that may not have adequate construction height.
According to catalogue details, the apparatus is fitted with an inlet pipe with diameters of 250 to 350 mm, an adjustment valve for airflow volume, and a port for DOP testing. Placing and sealing the terminal filter is essential.
A gel-sealing or knife-edge arrangement helps prevent unfiltered air from bypassing the filter and entering the plenum. IEST-RP-CC001 and MIL-STD-282 stipulate standards for HEPA filter testing and performance in critical environments [10][11].
The target particle size of a filter does not determine the filter grade. Other factors, such as airflow and terminal filter configuration, also establish which filter should be used.
Cleanroom air quality and room-level verification
Cleanroom air quality is a room-specific feature: how air filters improve indoor air quality inside a cleanroom is judged at room level, not at the filter. A filter with 99.995% efficiency cannot provide the expected cleanliness if it is not correctly installed, sealed properly, and used with appropriate airflow rates.
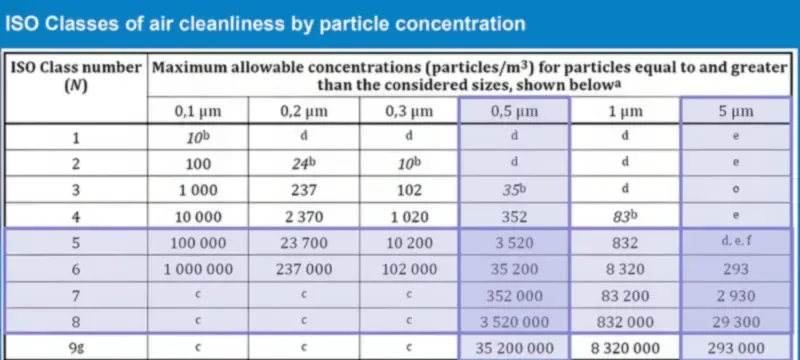
iso 14644-1:2015 outlines classification based on airborne contamination through particle count, the standard that turns cleanroom air quality into a measurable number. It classifies airborne particles in the size range of 0.1–5 µm using a light-scattering particle counter in an air sampling device [7]. iso 14644-3:2019 describes testing methods for leakage, airflow, pressure differences, and recovery time [8].
Linking filtration to ISO cleanroom classification
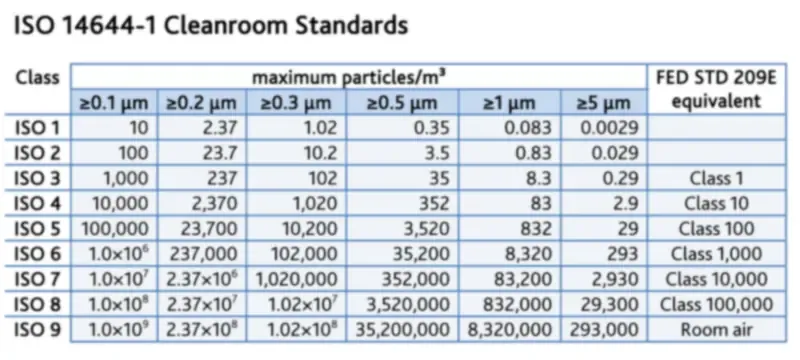
ISO cleanroom classification indicates the maximum allowable concentration of airborne particles with defined sizes. Under iso 14644-1:2015, the maximum concentration for an ISO Class 6 cleanroom is 35,200 particles ≥0.5 µm per cubic meter at rest [7]. For iso class 5, the limit is 3,520 particles ≥0.5 µm per cubic meter.
The sampling plan shows the cleanroom sampling locations for particle counts. Actual location count may vary because each room has a different applicable classification procedure. The sampling plan specifies the number of sampling sites and the method of data generation under the ISO 14644-1 classification protocol [7].
Only particle populations with cumulative distribution from 0.1 to 5 µm are considered for classification. Filtration alone is not sufficient for cleanroom classification, and air change rates do not determine the classification or required filter size.
Air change rate and other operating conditions affect the level of contaminant particles.
Project case study: cleanroom filter solution
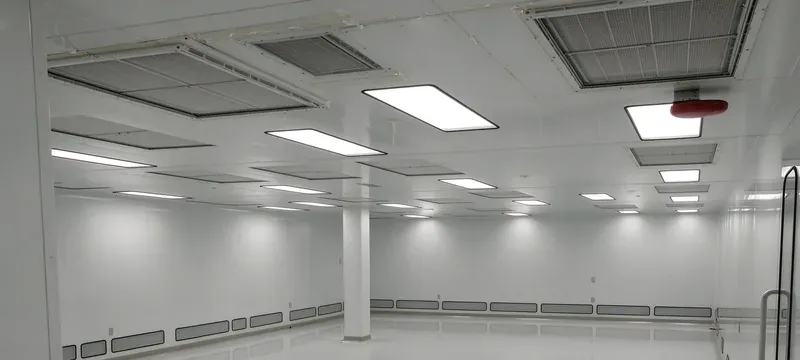
This project is a customer project. The level of detail in this report is limited to data supplied by the project team, and independent verification of measurement results has not been done.
A pharmaceutical packaging cleanroom seeking class 1000 (ISO 6) status had to deal with high outside particle load, small plenum height, and strict limits on pressure drop to maintain laminar flow. Deiiang supplied low-profile H14 combined high-efficiency filters (592 mm × 592 mm × 292 mm, 2,500 m³/h, initial resistance ≤220 Pa, media area 20.04 m²) with silicone-free gaskets and F7 pre-filters.
Each unit underwent per-unit DOP scan testing as per Deiiang quality control protocol. The low-profile 292 mm depth accommodated restrictions on plenum height. The low initial pressure drop preserved necessary flow velocities for laminar flow.
As reported by the project, particle counts decreased from the ISO 7 baseline to stable ISO 6 particle counts during operational hours. Low initial pressure drop led to project-reported energy savings compared with the previous higher-resistance filter configuration.
Project-reported facts:
- Application: pharmaceutical packaging cleanroom, ISO 6 target
- Challenge: high particle loading, limited plenum height, pressure drop
- Solution: Deiiang H14 combined high-efficiency filters with F7 pre-filters
- Filter specification: 592 mm × 592 mm × 292 mm, 2,500 m³/h, 20.04 m² media area
- Verification: per-unit DOP scan testing before shipment; particle counts reported per ISO 14644-1
- Reported outcome: change from ISO 7 to ISO 6 during operational hours, with customer-reported energy savings
- Measurement basis: particle counts and fan-power comparison reported by project team; full documentation was not available for independent review
Pressure drop, airflow, and energy trade-offs
Filter resistance to airflow is described as pressure drop measured in Pascals. Initial resistance is pressure drop across the clean filter. Final resistance is pressure drop at which the filter should be replaced.
The difference between initial and final resistance is related to the energy required to operate the fan during the filter’s lifetime. Deiiang catalogue data for the Combined High Efficiency Filter gives model-specific initial resistance: ≤200 Pa for H13 and ≤220 Pa for H14 at rated airflow. Final resistance is 400–600 Pa.
Understanding pressure drop across the filter life
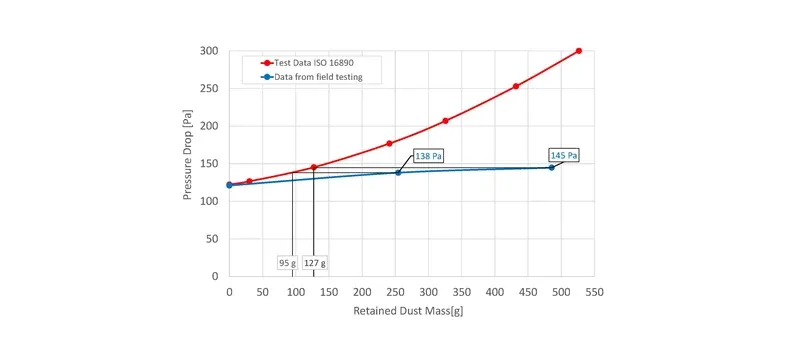
As more particles are deposited on filter media, pressure drop rises, and this is where the link between air filters and indoor air quality shows up in daily operation. The rate of rise depends on the dust loading rate, particle size distribution, and filter performance characteristics.
The trend chart shows pressure drop over operating hours for a filter at constant airflow. The curve rises slowly in early loading and then accelerates as it approaches final resistance. The final resistance threshold is a recommendation, not a fixed value.
Deiiang catalogue data indicates the 2,500 m³/h Combined High Efficiency Filter can hold about 1,200 g of dust. Dust-holding capacity and lifespan depend on test methods and operating conditions, so air filter replacement frequency cannot be predicted from catalogue data alone. Differential pressure indicates the real-time trend.
Balancing airflow, filtration, and energy
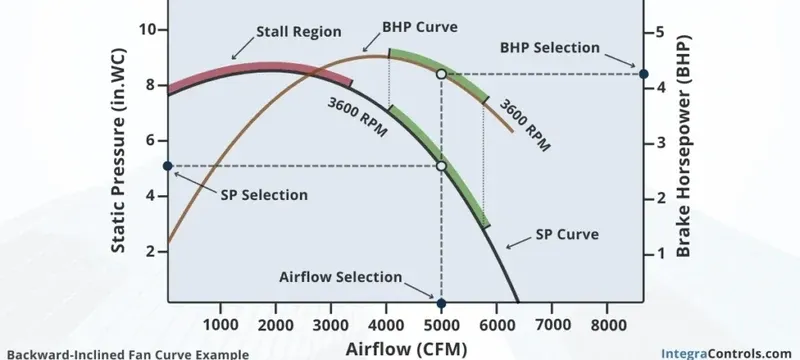
A system must balance three factors: filtration efficiency, airflow to the occupied space, and fan energy use. That balance is what decides how air filters improve indoor air quality. At a given flow rate, air power equals flow multiplied by pressure rise. Electrical input also depends on fan and motor efficiency.
For a system providing 2,500 m³/h (0.694 m³/s) across a filter with initial pressure drop of 220 Pa, air power is 0.694 × 220 = 153 W. At 500 Pa, air power is 0.694 × 500 = 347 W. With combined fan and motor efficiency of 0.585 (0.65 × 0.90), electrical input changes from about 261 W to 593 W.
The cube law describes fan speed and power under particular similarity conditions. It does not directly relate pressure drop to power at constant speed.
Deiiang’s Super High Efficiency Baffle-Free Filter (U15/U16/U17) has model-specific data. The 610×610×50 mm model produces 450 m³/h at 150–170 Pa initial resistance and uses 7.13 m² media area. These values are unique to this model and cannot be compared directly with deeper filters without matching airflow, face area, grade, and housing.
Maintenance, monitoring, and replacement
The air filter replacement frequency is determined by the conditions of the environment, not by the calendar. A filter in a clean office may not require replacement for 12 months; the same filter in a high-particulate process facility may need changing every 3 months. These examples are illustrative only.
Actual air filter replacement frequency depends on the rate of differential pressure increase, designed airflow, current filter condition, manufacturer limits, and applicable maintenance requirements.
Setting air filter replacement frequency
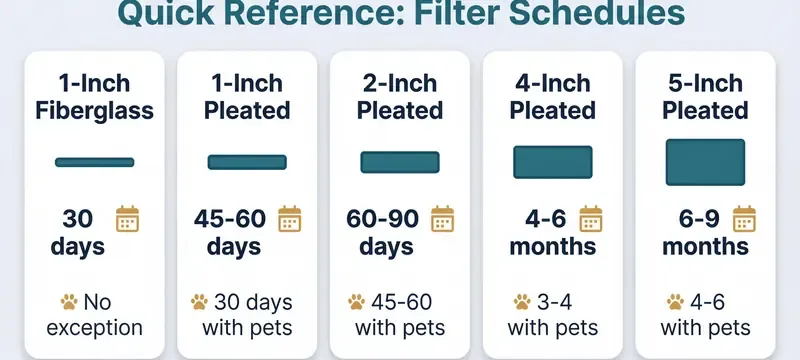
Air filter replacement frequency must be determined at the system level and placed in the maintenance plan. Manufacturer limits are a guideline, but actual operating parameters determine replacement frequency.
The decision process begins with air pressure readings from filters. If pressure reaches the recommended value — for example, 400–600 Pa for Deiiang high-efficiency filters per catalogue data — replacement is indicated. If airflow drops below the minimum acceptable value before that pressure is reached, filters must be checked for damage or collapse.
An example performance record:
| Date | Airflow (m³/h) | Pressure Drop (Pa) | Recommended Action |
|---|---|---|---|
| 01 Mar | 2,480 | 210 | Baseline reading |
| 01 Jun | 2,450 | 340 | Trend noted |
| 01 Sep | 2,390 | 480 | Approaching final resistance |
| 15 Sep | 2,310 | 520 | replace filters; inspect seals |
| Date | Pressure Drop (Pa) | Recommended Action |
|---|---|---|
| 01 Mar | 210 | Baseline reading |
| 01 Jun | 340 | Trend noted |
| 01 Sep | 480 | Approaching final resistance |
| 15 Sep | 520 | replace filters; inspect seals |
Monitoring performance and preventing bypass
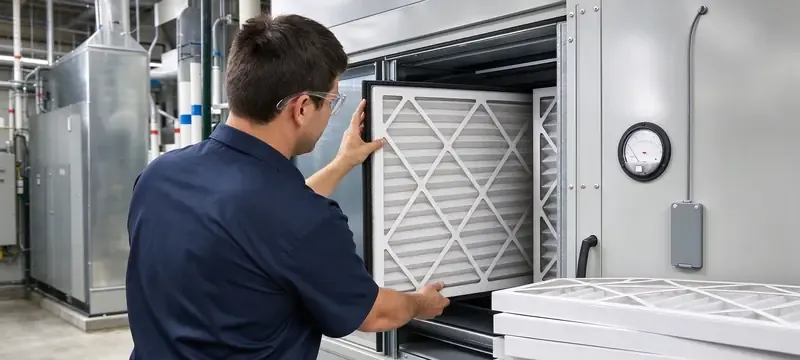
A filter meeting manufacturer specifications during testing may still perform improperly due to installation leaks or seal decay, and that is one of the common ways the link between air filters and indoor air quality is broken. Monitoring installed performance is as critical as selecting the proper filter.
If there is a sudden increase in particle counts, follow this troubleshooting sequence: confirm the particle measurement method and room condition; check airflow and pressure balance; inspect seals and housings; review filter installation and damage; then retest. Replacing the filter without solving the cause may not fix the problem.
Two field-validated checks are useful:
Check nominal filter dimensions against actual dimensions; filters and housings from different suppliers may differ slightly, which affects sealing.
Check gasket compression after installation; a properly seated gasket may not achieve enough compression to avoid bypass.
Confirm airflow at the specified duty point rather than at an assumed operating condition.
These checks are based on field observations, not statistics showing failure rates.
Selection and implementation for facility teams
Facility teams turn air quality needs into purchase requirements that include filter size, performance ratings, test documents, and compatibility, and this step is what sustains the link between air filters and indoor air quality. Deiiang provides catalogue data comprising model size, airflow rating, media area, initial and final resistance, and efficiency classifications.
Building a filter specification and submittal
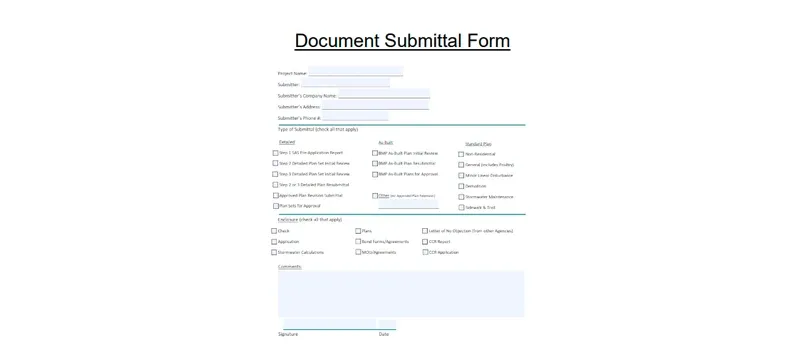
A filter specification should include dimensions and tolerances, airflow at rated conditions, initial and final resistance, test standard and edition, efficiency basis, frame and gasket materials, temperature and humidity limits, and required certificates.
The stacked stages run from specification issuance through submittal review to purchase order. Important documents include the filter datasheet with rated performance, test certificates for HEPA and ULPA filters, and confirmation of compatibility with existing filter housings and sealing arrangements.
For cleanroom filters, factory test requirements and on-site acceptance test requirements should be defined separately. Factory element testing and on-site installed-filter leak testing are different processes with their own acceptance criteria.
The specification should define required tests, test methodology and edition, and acceptance thresholds.
Commissioning, acceptance, and lifecycle records
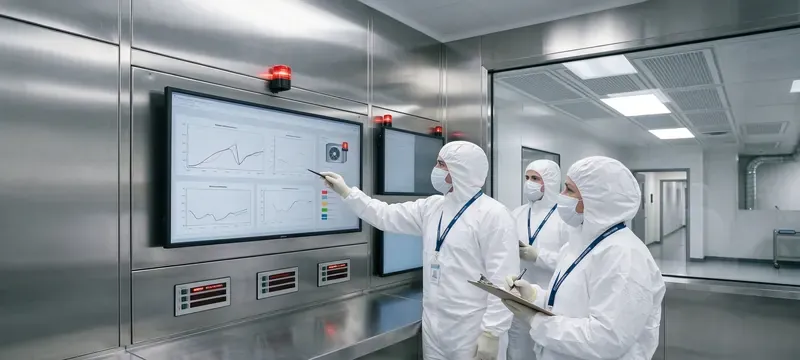
Commissioning determines whether the installed filter operates according to specification. Acceptance test records document results. Lifecycle records support future maintenance and replacement decisions.
The commissioning record flow begins with installation verification - frame alignment, sealing, and filter position - because cleanroom air quality depends on all three. Acceptance testing follows, including differential pressure measurement, airflow verification, and leak testing of HEPA installations per ISO 14644-3 [8].
Filter installation verification, air balancing, filter leak testing, and room classification are related but not interchangeable.
Records should include date, filter model and serial number, instrument identification, calibration status, airflow measurement, differential pressure reading, leak test result if applicable, and acceptance determination. Records should be updated after scheduled maintenance.
Frequently Asked Questions
Do air filters improve indoor air quality?
Yes. Air filters can improve indoor air quality by removing airborne particles from the space. They work best with adequate air changes per hour and no bypass leakage. They do not remove gaseous contaminants or eliminate particle sources.
What does an air filter MERV rating tell me?
The MERV rating indicates a filter’s minimum particle removal efficiency in three size categories under ASHRAE 52.2-2017 [6]. A MERV 13 filter must be at least 50% efficient for 0.3–1.0 µm particles. The rating does not represent installed performance.
Are HEPA filters always the best choice for HVAC systems?
HEPA filters are highly effective, but they may restrict airflow in many HVAC fans. Good indoor air quality can often be achieved with MERV 13–15 filters in commercial systems. HEPA filters are required in applications supporting ISO 5–6 cleanroom environments.
How often should an HVAC air filter be replaced?
replace when pressure drop reaches the manufacturer’s final resistance, airflow falls below acceptable levels, or inspection indicates damage or contamination. Deiiang catalogue data lists final resistance of 400–600 Pa for combined high-efficiency filters and 250–400 Pa for medium-efficiency bag filters. Actual intervals depend on operating conditions.
How are cleanroom air filters tested after installation?
Installed HEPA filters are tested for leakage using a photometer and aerosol challenge, scanning the filter face, frame, and seals. ISO 14644-3:2019 defines the test methods for installed filter system leakage, airflow, and pressure difference [8]. Airflow verification confirms design air volumes.
Can air filters remove odors and gases?
Standard particle filters do not remove odors or gases. Activated carbon and chemisorbent media can remove gas-phase pollutants, but sorbent capacity is limited. Gas-media replacement must follow the pollutant, capacity, and monitoring plan.
References
- [1] EN 1822-1:2019, High efficiency air filters (EPA, HEPA and ULPA) — Part 1: Classification, performance testing, marking. CEN.
- [2] ISO 29463-1:2024, High efficiency filters and filter media for removing particles in air — Part 1: Classification, performance, testing and marking. ISO.
- [3] ISO 29463-4:2011, High efficiency filters and filter media for removing particles in air — Part 4: Test method for determining leakage of filter elements — Scan method. ISO.
- [4] ISO 29463-5:2022, High efficiency filters and filter media for removing particles in air — Part 5: Test method for filter elements. ISO.
- [5] ISO 16890-1:2016, Air filters for general ventilation — Part 1: Technical specifications, requirements and classification system based upon particulate matter efficiency (ePM). ISO.
- [6] ASHRAE Standard 52.2-2017, Method of Testing General Ventilation Air-Cleaning Devices for Removal Efficiency by Particle Size. ASHRAE.
- [7] ISO 14644-1:2015, Cleanrooms and associated controlled environments — Part 1: Classification of air cleanliness by particle concentration. ISO.
- [8] ISO 14644-3:2019, Cleanrooms and associated controlled environments — Part 3: Test methods. ISO.
- [9] EN 779:2012, Particulate air filters for general ventilation — Determination of the filtration performance (withdrawn; superseded by ISO 16890). CEN.
- [10] IEST-RP-CC001, HEPA and ULPA Filters. IEST.
- [11] MIL-STD-282, Filter Units, Protective Clothing, Gas-Mask Components and Related Products: Performance Test Methods. U.S. Department of Defense.