+86 13638632902
 Jason@cleanroomequips.com


 MENU
MENU
Executive Summary
Sand filtration — stabilizes TSS/NTU, protects downstream units.
Activated carbon — adsorbs chlorine, odor, DOC; finite capacity.
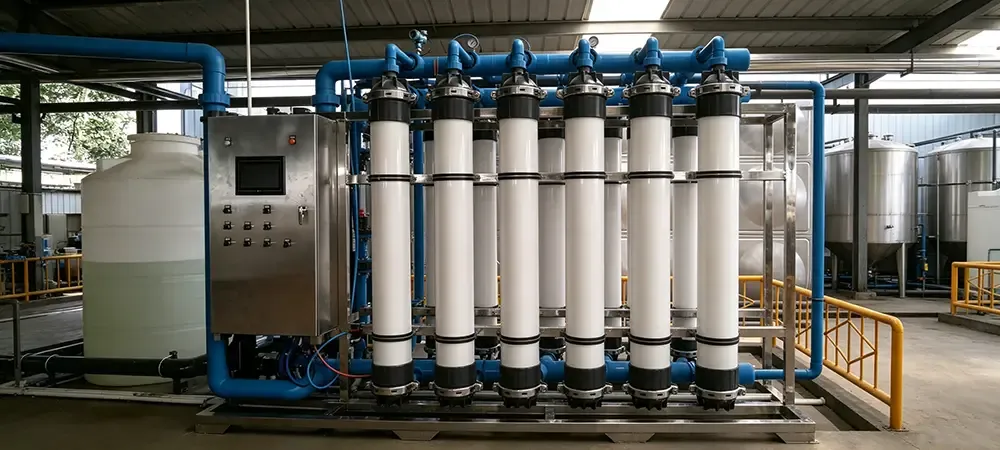
Ultrafiltration (UF) — removes colloids & bacteria, stabilizes SDI.
Reverse osmosis (RO) — desalination; concentrate pathway is critICal.
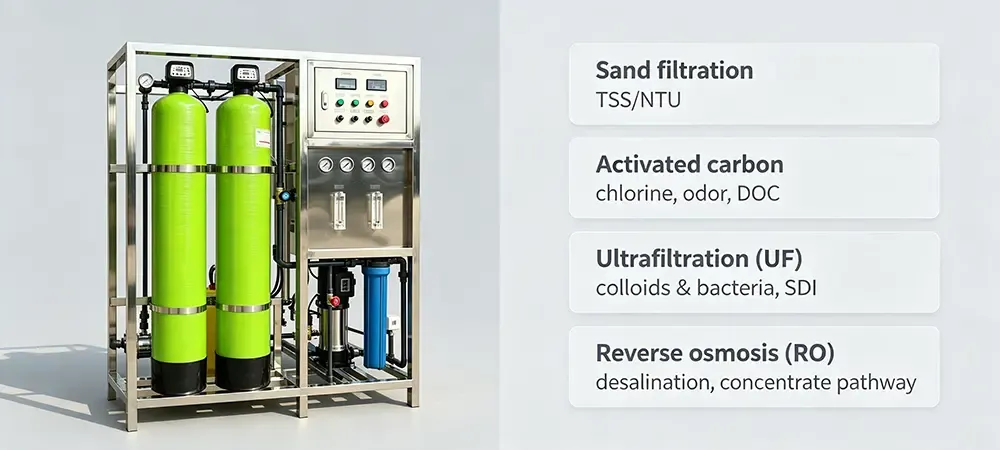
Sand filtration — stabilizes TSS/NTU, protects downstream units.
Activated carbon — adsorbs chlorine, odor, DOC; finite capacity.
Ultrafiltration (UF) — removes colloids & bacteria, stabilizes SDI.
Reverse osmosis (RO) — desalination; concentrate pathway is critICal.
Why "one-size-fits-all" fails
The use of sand filter, activated carbon filter, ultrafiltration, and reverse osmosis must match contaminant size. A single technology cannot span six orders of magnitude.
Pollutant morphology and scale mapping
Sand filters remove 10–100 µm particles. UF screens 0.01–0.1 µm colloids. GAC adsorbs molecules below 2 nm. RO rejects ions under 1 nm. Treating 5 µm particles with RO is wasteful. Using sand to remove sodium ions defies physICs.
Misalignment causes most underperformance. At Deiiang™, RO membranes fouled in 90 days because upstream floc carryover bypassed the sand filter. A properly sized sand filter would have solved it at one-tenth the cost.
Jason.peng insight: In Yangtze River basin lithium battery projects, RO membranes failed prematurely. The root cause was manual backwash valves on sand filters. Operators skipped night‑shift backwash. Turbid water hit UF and RO directly. Automatic valves would have saved tens of thousands in membrane replacement.
Key water quality indicators
Fractionate COD into particulate, colloidal, and dissolved phases. Map turbidity, UV₂₅₄, conductivity, hardness, and SDI₁₅. A 120 mg/L COD may be 80% particulate (sand filter), 15% colloidal (UF), 5% dissolved (GAC).
Pretreatment failure chain — how upstream upsets cascade downstream
Treatment trains are only as strong as their weakest link. A small disturbance triggers a domino effect that damages expensive downstream assets.
Sand filter
breakthrough
NTU spike >5
breakthrough
NTU spike >5
→
UF fiber
clogging / breakage
CEB frequency ↑
clogging / breakage
CEB frequency ↑
→
RO membrane
irreversible fouling
SDI₁₅ >4
irreversible fouling
SDI₁₅ >4
GAC chlorine
breakthrough
Cl₂ >0.1 mg/L
breakthrough
Cl₂ >0.1 mg/L
→
RO polyamide
oxidation damage
salt rejection ↓
oxidation damage
salt rejection ↓
Two failure chains dominate field calls: (1) turbidity escape from a poorly backwashed sand filter forces UF into accelerated CEB, shortens membrane life, and risks fiber breakage. (2) Exhausted GAC lets free chlorine oxidize RO polymer, causing irreversible salt rejection loss within 200–1,000 ppm‑hours.
AdXvm-M2f-Y
3‑step selection method
Identify dominant phase: particulate, colloidal, dissolved organic, or ionic.
Set numeric targets: NTU <0.1, SDI₁₅ <3, conductivity <10 µS/cm.
Match technology: particulate → sand; colloidal + microbial → UF; dissolved organics + chlorine → GAC; ionic → RO.
Sand Filtration
The use of sand filter is essential for reliable particulate removal. A properly designed bed delivers effluent below 1 NTU from 15–30 NTU feed, ACHieving 85–95% TSS removal. Deiiang™ projects report 48–72 h between backwash cycles.
⚡ Operational Alert (Seasonal): When raw water NTU exceeds 50, adjust sand filter backwash from 48h to 12h. Increase PAM dose by 0.5 ppm.
Pro Tip: Always specify automatic backwash valves for sand filters.
Scenarios & design
Post‑clarification floc capture, GAC/UF pre‑filter, and final polishing. Design at 5–12 m/h with d₁₀ 0.35–0.55 mm, UC <1.6. Backwash at 30–50 m/h uses 2–4% of daily flow. Fine floc (<50 µm) shortens filter runs.
Deiiang™ Sand Filter Data
TSS removal: 88–96%
Backwash water: 2.2–4.5% of throughput
Effluent turbidity: 0.5–2.0 NTU
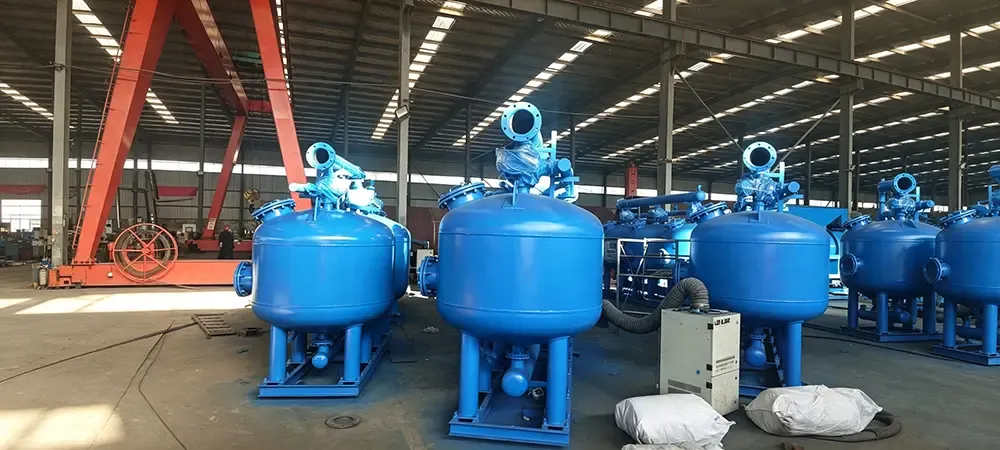
Fig.1 — Sand filter depth filtration.
Granular Activated Carbon (GAC)
The use of activated carbon filter solves dissolved organics and chlorine. With 800–1,200 m²/g surface, it adsorbs molecules that pass physical barriers. Capacity is finite — a 2 m³ vessel at 10 min EBCT may last 15,000–25,000 bed volumes before chlorine breakthrough. NOM pre‑loading cuts target adsorption by 30–50%.
Pro Tip (Jason's start‑up rule): Soak new GAC for 24 h and fully vent before startup. Trapped air causes channeling and early chlorine breakthrough. Deiiang™ mandates a 100 µm stainless steel screen downstream.
Field Experience — Carbon Fines: Low‑hardness coal carbon sheds fines after first backwash, clogging UF fibers. Deiiang™ uses coconut shell carbon with hardness >95%.
Scenarios & lifecycle
Dechlorination (1–3 mg/L to <0.1 mg/L), DOC polishing (40–70% UV₂₅₄ reduction), odor removal, biological activated carbon. EBCT 8–15 min for chlorine, 15–30 min for DOC. Thermal reactivation restores 85–95% capacity with 5–10% mass loss per cycle.
Monitoring risks
Track ΔP and online UV₂₅₄. Excessive biofilm causes channeling and sloughing. HPC >10,000 CFU/mL demands investigation.
Chlorine Breakthrough vs EBCT
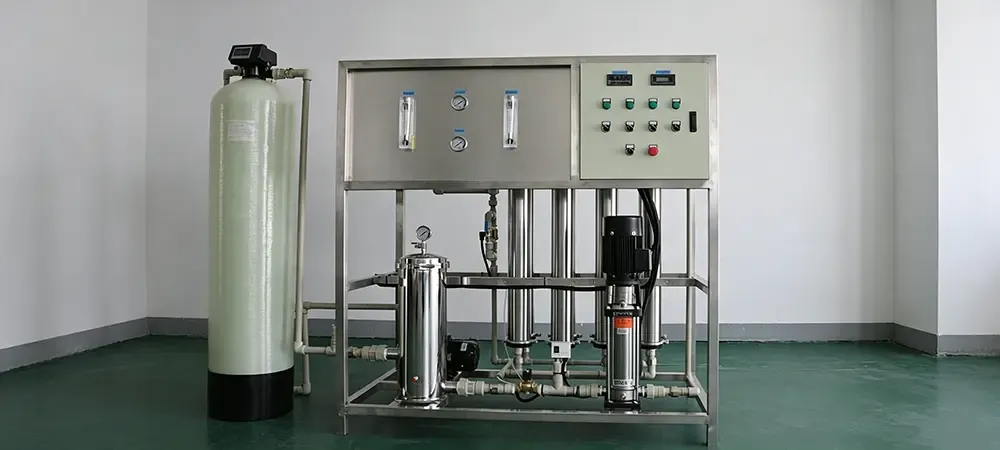
Fig.2 — Breakthrough curve at different EBCT values.
Ultrafiltration (UF)
The use of ultrafiltration (UF) bridges granular filtration and RO. A 0.02 µm membrane achieves >4‑log bacteria removal, effluent turbidity<0.1 NTU, and SDI₁₅ <2.5. Deiiang™ Electronics reuse applications show SDI₁₅ averaging 1.8–2.2.
⚡ Operational Alert (Monsoon): When treating Yangtze River water with seasonal turbidity 8→55 NTU, install flow‑paced coagulant dosing. If SDI₁₅ rises above 3.5, reduce UF flux by 15% temporarily.
Removal spectrum & fouling control
UF rejects colloids, bacteria, macromolecules >100 kDa. It passes salts, dissolved silica, and small organics. Operate at 40–70 LMH, TMP 0.3–1.5 bar. Backwash every 25–45 min; CEB every 12–48 h. CIP when TMP exceeds 1.5× baseline.
SDI stability matters more than average. A fluctuation between 1.5 and 3.8 damages RO more than a steady 2.8.
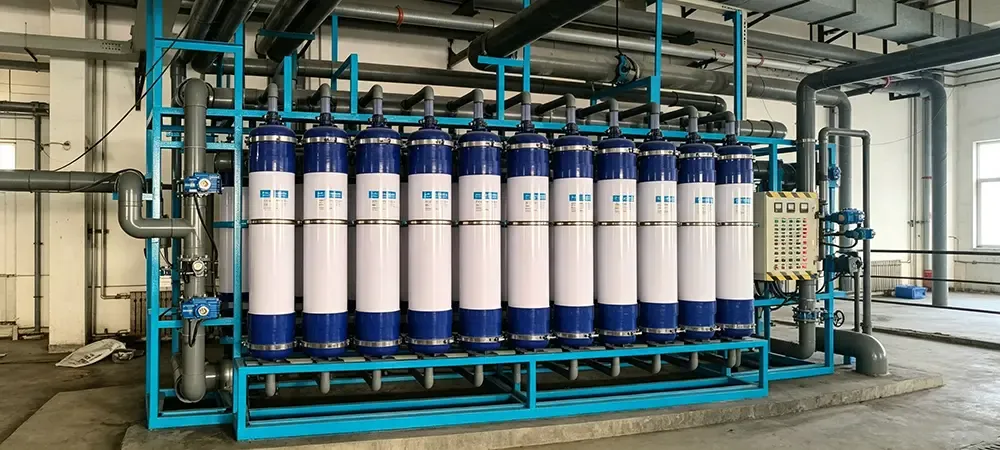
Deiiang™ UF Snapshot
Effluent turbidity: <0.08 NTU
SDI₁₅: 1.5–2.5
TMP ramp: 0.02–0.06 bar/week
CIP interval: 45–90 days
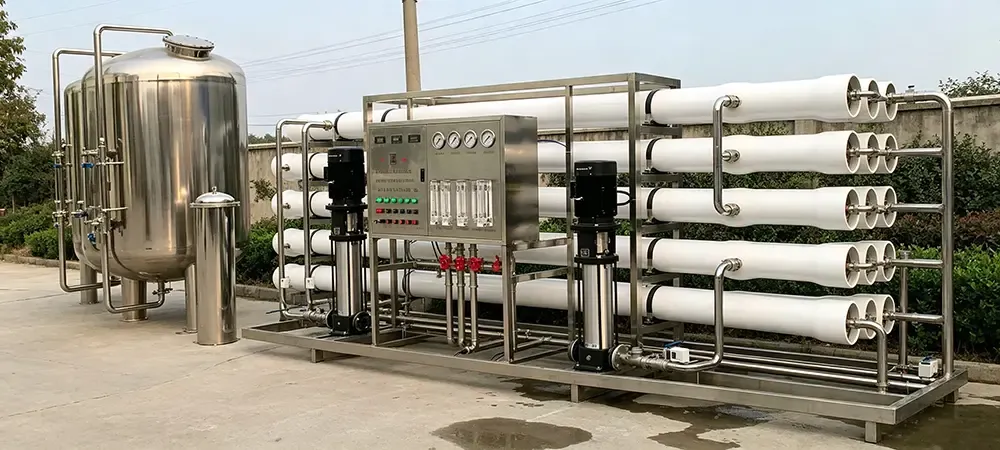
Reverse Osmosis (RO)
The use of reverse osmosis (RO) targets ionic separation. Polyamide membranes reject 99.0–99.7% NaCl. Deiiang™ two‑stage systems reduce conductivity from 1,200 µS/cm to 18–35 µS/cm at 75% recovery. RO generates concentrate at 4× feed salinity — 25 m³ per 100 m³ feed.
Jason’s Rule of Thumb (Membrane Replacement): replace elements when normalized permeate flow drops 15% or salt rejection falls below 90% of initial value, and two consecutive CIPs fail to restore performance.
⚠️ Industry Warning — Aged / Refurbished Membranes: Dry‑stored membranes lose 3–5% performance per year. In a lithium battery project, using库存膜 increased feed pressure by 2 bar, adding ~$1,200/year per 8‑inch element.
Critical conditions & concentrate
Pretreatment: SDI₁₅ <2.5, chlorine <0.1 mg/L, iron <0.05 mg/L. Antiscalant 2–5 mg/L. Recovery limited by least soluble salt. Concentrate options: sewer discharge, recycling, ZLD ($3–8/m³), resource recovery. Without a viable pathway, RO is not feasible. For downstream polishing, EDI is often required.
Deiiang™ RO Data
Recovery: 72–78%
Permeate: 12–35 µS/cm
Flow decline: <8%/year
CIP recovery: 92–98%
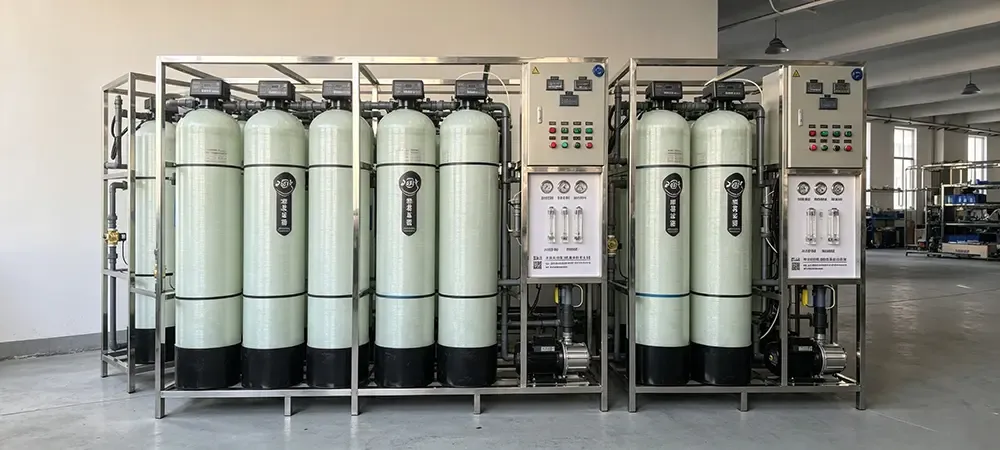
Selection Framework
Target‑first approach
Discharge TSS 30 mg/L needs only sand. Cooling tower <500 µS/cm may need RO. Boiler <10 µS/cm demands RO. Map each parameter to its numeric threshold.
Typical process trains
| Raw Water | Train | Risk |
|---|---|---|
| Surface NTU 10–50 (Yangtze) | Coag→SF→Disinfection | Coagulant drift |
| 2° effluent COD 40–80 | SF→GAC→UF | GAC breakthrough |
| Brackish TDS 2k–5k (North) | SF→Antiscalant→RO | BaSO₄ scaling |
| Boiler feed | UF→RO→EDI | UF fiber breakage |
| Water | Train |
|---|---|
| Surface (Yangtze) | Coag→SF |
| 2° effluent | SF→GAC→UF |
| Brackish (North) | SF→RO |
| Boiler | UF→RO→EDI |
Four long‑term costs
Water losses (3–8%), energy (0.8–1.5 kWh/m³ brackish RO), membrane/media replacement (RO every 3–5 yr), concentrate disposal (up to $5/m³). CAPEX is only 25–35% of 10‑year TCO.
OPEX Comparison — Cost per 1,000 m³ Treated
Operating expenditure drives 65–75% of lifecycle cost.
| Technology | Consumable | Energy (kWh/1,000 m³) | Dominant OPEX |
|---|---|---|---|
| Sand Filter | Media top‑up 5–8 yr | 20–45 | Backwash water |
| GAC | Regeneration 1–3 yr | 15–30 | Carbon reactivation |
| UF | Elements 5–7 yr | 100–250 | Membrane & chemicals |
| RO | Elements 3–5 yr | 800–1,500 | Energy + concentrate |
| Tech | Consumable | Energy/1,000 m³ |
|---|---|---|
| Sand Filter | 5–8 yr | 20–45 kWh |
| GAC | 1–3 yr | 15–30 kWh |
| UF | 5–7 yr | 100–250 kWh |
| RO | 3–5 yr | 800–1,500 kWh |
⚡ RO Energy Cost Estimator (Per Year)
Estimated Annual Energy Cost: —
Assumption: 0.9 kWh/m³ per 1,000 mg/L TDS, 8,000 operating hours/year.
When NOT to install RO
No concentrate disposal pathway.
SDI₁₅ consistently >5 without pretreatment upgrade.
Free chlorine present with no dechlorination.
Target met by UF alone.
Feed temperature >40°C continuously.
Feed water contains organosilicon compounds (e.g., silicone oils, siloxanes).
High fluoride concentration (>10 mg/L) with calcium present — CaF₂ scaling risk.
Data & Visualization
Performance bars
Sand Filter TSS Removal
GAC DOC Reduction
UF Bacteria Removal
RO NaCl Rejection
Scale mapping & pretreatment thresholds
| Parameter | SF Feed | GAC Feed | UF Feed | RO Feed |
|---|---|---|---|---|
| SDI₁₅ | — | <5 | <8 | <2.5 |
| Cl₂ (mg/L) | <5 | <5 | <200(PVDF) | <0.1 |
| Temp (°C) | 5–40 | 5–50 | 5–40 | 10–35 |
| Parameter | RO Feed |
|---|---|
| SDI₁₅ | <2.5 |
| Cl₂ | <0.1 mg/L |
| Temp | 10–35°C |
Pull Quote
"Select by contaminant morphology, not price. A well‑designed sand filter protecting membranes delivers more value than a misapplied RO system with unmanageable concentrate."
— Jason.peng, Deiiang™
Deiiang™ Product Data & Methodology
Test standards
Turbidity iso 7027; SDI ASTM D4189; UV₂₅₄ SM 5910B; RO rejection ASTM D4516; GAC breakthrough ASTM D6586.
SF Unit
Feed NTU 18±6
Eff 0.8±0.3
Feed NTU 18±6
Eff 0.8±0.3
GAC Unit
EBCT 12 min
DOC -55%
EBCT 12 min
DOC -55%
UF Unit
PVDF 0.02µm
SDI₁₅ 1.9
PVDF 0.02µm
SDI₁₅ 1.9
RO Unit
Feed 1180 µS/cm
Perm 22 µS/cm
Feed 1180 µS/cm
Perm 22 µS/cm
Deiiang™ Case Studies
Case 1: Lithium battery reuse (Yangtze River basin)
120 m³/h, target <5 µS/cm. Raw: TDS 850 mg/L, NTU 8–25. Solution by Jason.peng: Coag→SF→GAC→UF→RO→EDI. Results: RO flow decline <6%/yr, SDI₁₅ 1.6–2.1, permeate 2–4 µS/cm. Concentrate to ZLD ponds.
Case 2: Municipal reuse polishing (East China)
200 m³/h to Class A. Rainy season turbidity spikes 8→55 NTU in 2 h. Installed flow‑paced coag + dual‑media SF + pressurized UF. UF effluent <0.06 NTU, SDI₁₅ 1.5–2.0 year‑round.
FAQs
Can UF replace sand + carbon?
UF replaces sand for turbidity, but not GAC for dissolved organics or dechlorination.
Is carbon always before RO?
Only if oxidants present. Dechlorination is mandatory.
Safe SDI for RO?
SDI₁₅ <3 minimum, <2.5 recommended.
GAC breakthrough planning?
Pilot test, online UV₂₅₄, budget 5–10% makeup carbon.
No concentrate pathway?
RO is infeasible. Explore sewer, high‑recovery, ZLD.
References
AWWA B100
ASTM D4189
ASTM D4516
ASTM D6586
ISO 7027
WHO Guidelines
GB/T 19249
© 2026 Deiiang™ | Designer: Jason.peng