+86 13638632902
 Jason@cleanroomequips.com


 MENU
MENU
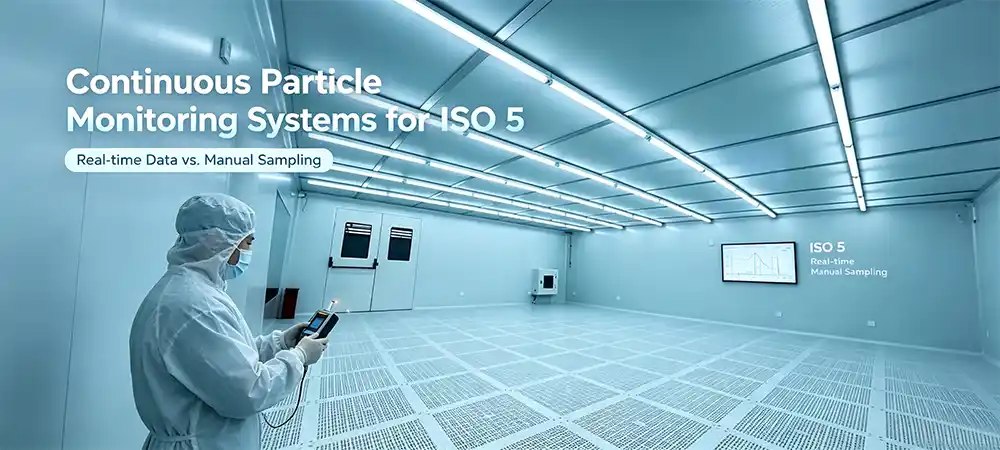
Although continuous particle monitoring systems offer quicker contamination alerts compared to manual sampling methods, they do not serve as substitutes for the classification testing associated with iso 5 cleanrooms. In this article, we will explain how monitoring systems together with manual sampling methods enable risk-based monitoring according to iso 14644 standards.
Why ISO 5 Cleanrooms Need More Than Periodic Particle Counts
The "data gap" between manual samples
An ISO 5 production area completed manual sampling twice daily. Both results fell within internal action limits. Yet a particle-related deviation occurred during the night shift.
The investigation revealed particle spikes lasting several minutes during material transfer and equipment maintenance. Manual sampling had not covered that window.
A passing sample proves the state at a specific time and location. Short-duration contamination events can occur between two manual readings. For critical processes, real-time particle monitoring helps establish the timeline of events.
Continuous data helps build temporal relationships between personnel activity, equipment status and particle variations.
ISO 5 does not mean all zones share the same risk
Two rooms with the same iso 5 classification can have completely different process risks. An open product exposure zone is far more critical than a closed equipment corridor.
Monitoring strategy must consider product exposure, personnel activity, airflow direction, equipment emissions and contamination recovery capability. Do not distribute sampling points evenly by floor area alone.
In an ISO 5 cleanroom, a passing sample is a snapshot; a continuous data trend reveals what happened between the snapshots.
What ISO 14644-2 Actually Requires
The role distinction between ISO 14644-1 and ISO 14644-2
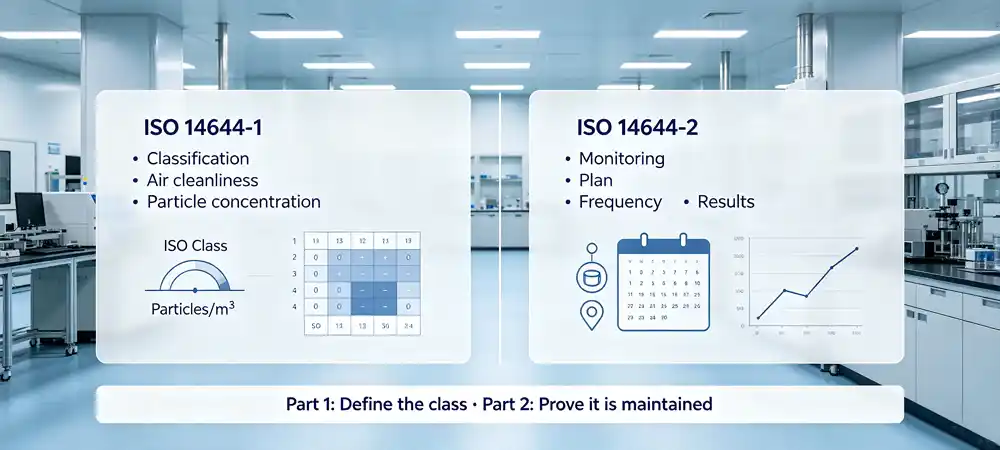
ISO 14644-1 is primarily used for classifying cleanrooms by airborne particle concentration. ISO 14644-2 focuses on performance monitoring, including establishing, implementing and documenting monitoring plans.
Cleanroom classification testing and routine operational monitoring are not equivalent. Continuous monitoring data does not automatically replace all formal classification or requalification activities.
| Aspect | Classification / Requalification | Routine Operational Monitoring |
|---|---|---|
| Primary purpose | Confirm cleanliness grade | Observe operational status and trends |
| Data characteristics | Verified data under specified conditions | Periodic or continuous operational data |
| Location basis | Classification method and room layout | Process risk, airflow and critical positions |
| Output | Classification / requalification report | Trends, alerts, deviation investigation records |
EU GMP Annex 1 vs. ISO 14644 — what you must know
ISO 14644 is a general industrial standard for cleanroom classification and monitoring. It emphasizes a risk-based approACH without mandating specific monitoring technologies or frequencies for all applications.
In contrast, EU GMP Annex 1 (2022/2023 revision) for sterile medicinal products imposes stricter requirements. For Grade A zones (which correspond to ISO 5 in operation), it mandates continuous particle monitoring for both ≥0.5µm and ≥5.0µm particles throughout the entire production process, including filling and aseptic operations.
This distinction is a common pain point: many pharmaceutical and biotech clients assume ISO 14644-2 compliance is sufficient for regulatory inspections, but Annex 1 explicitly requires real-time, continuous data with alarm limits and audit trails.
| Aspect | ISO 14644-2 | EU GMP Annex 1 (Grade A) |
|---|---|---|
| Scope | General cleanrooms (all industries) | Sterile medicinal products |
| Monitoring approach | Risk-based, flexible | Mandatory continuous monitoring |
| Particle size channels | ≥0.5µm, ≥5.0µm (ISO 5) | ≥0.5µm and ≥5.0µm during production |
| Alarm requirements | Recommended | Mandatory with action limits |
| Audit trail | Recommended | Mandatory for data integrity |
What a compliant monitoring plan must address
- Which parameters require monitoring?
- Which zones and process locations have the highest risk?
- Should you use continuous, periodic or hybrid monitoring?
- Why are the selected sampling positions representative?
- How is sampling frequency determined?
- How are alert and action limits established?
- Who responds to alerts and how?
- How long are data records retained?
Do not write "alert limits" as fixed values uniformly mandated by ISO 14644-2. Alert and action limits are typically established based on standard requirements, historical baselines, process risk and company procedures.
Compliance is not just collecting data — it is interpreting data
- Are raw data retained?
- Are timestamps uniform?
- Are user permissions tiered?
- Is alert acknowledgement recorded with operator and reason?
- Are modifications tracked via audit trail?
- Can calibration, maintenance and downtime periods be identified?
- Do exported reports retain contextual information?
Real-Time Particle Monitoring vs. Manual Sampling
How manual sampling works
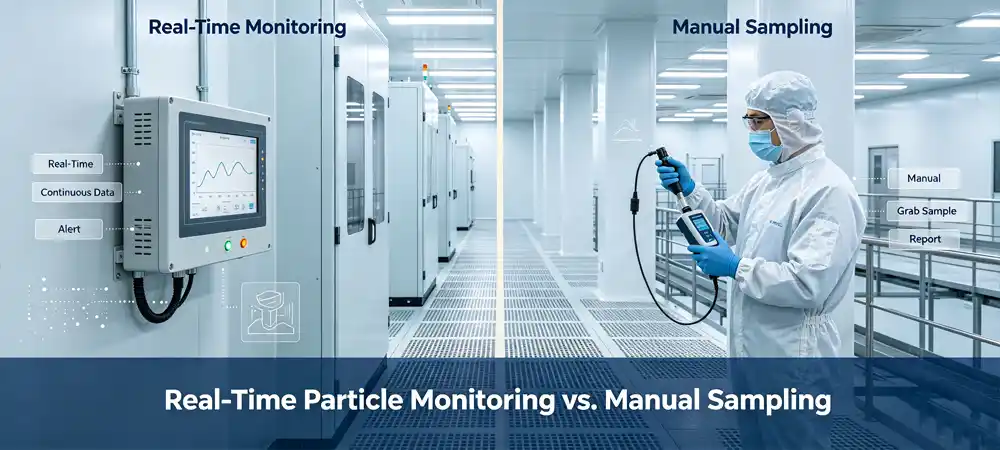
Technicians carry portable particle counters to predetermined locations, collect air samples of specified volume, record results manually or automatically, then compare against internal limits or verification standards.
Advantages
- Initial investment is relatively controllable
- Devices can be moved between locations
- Suitable for investigations and confirmations
- High flexibility for non-critical zones
Limitations
- Covers only limited time windows
- Operators may alter the local environment
- Position and technique may vary
- Hand transcription introduces recording errors
- Difficulty identifying short-duration events
How a continuous monitoring system works
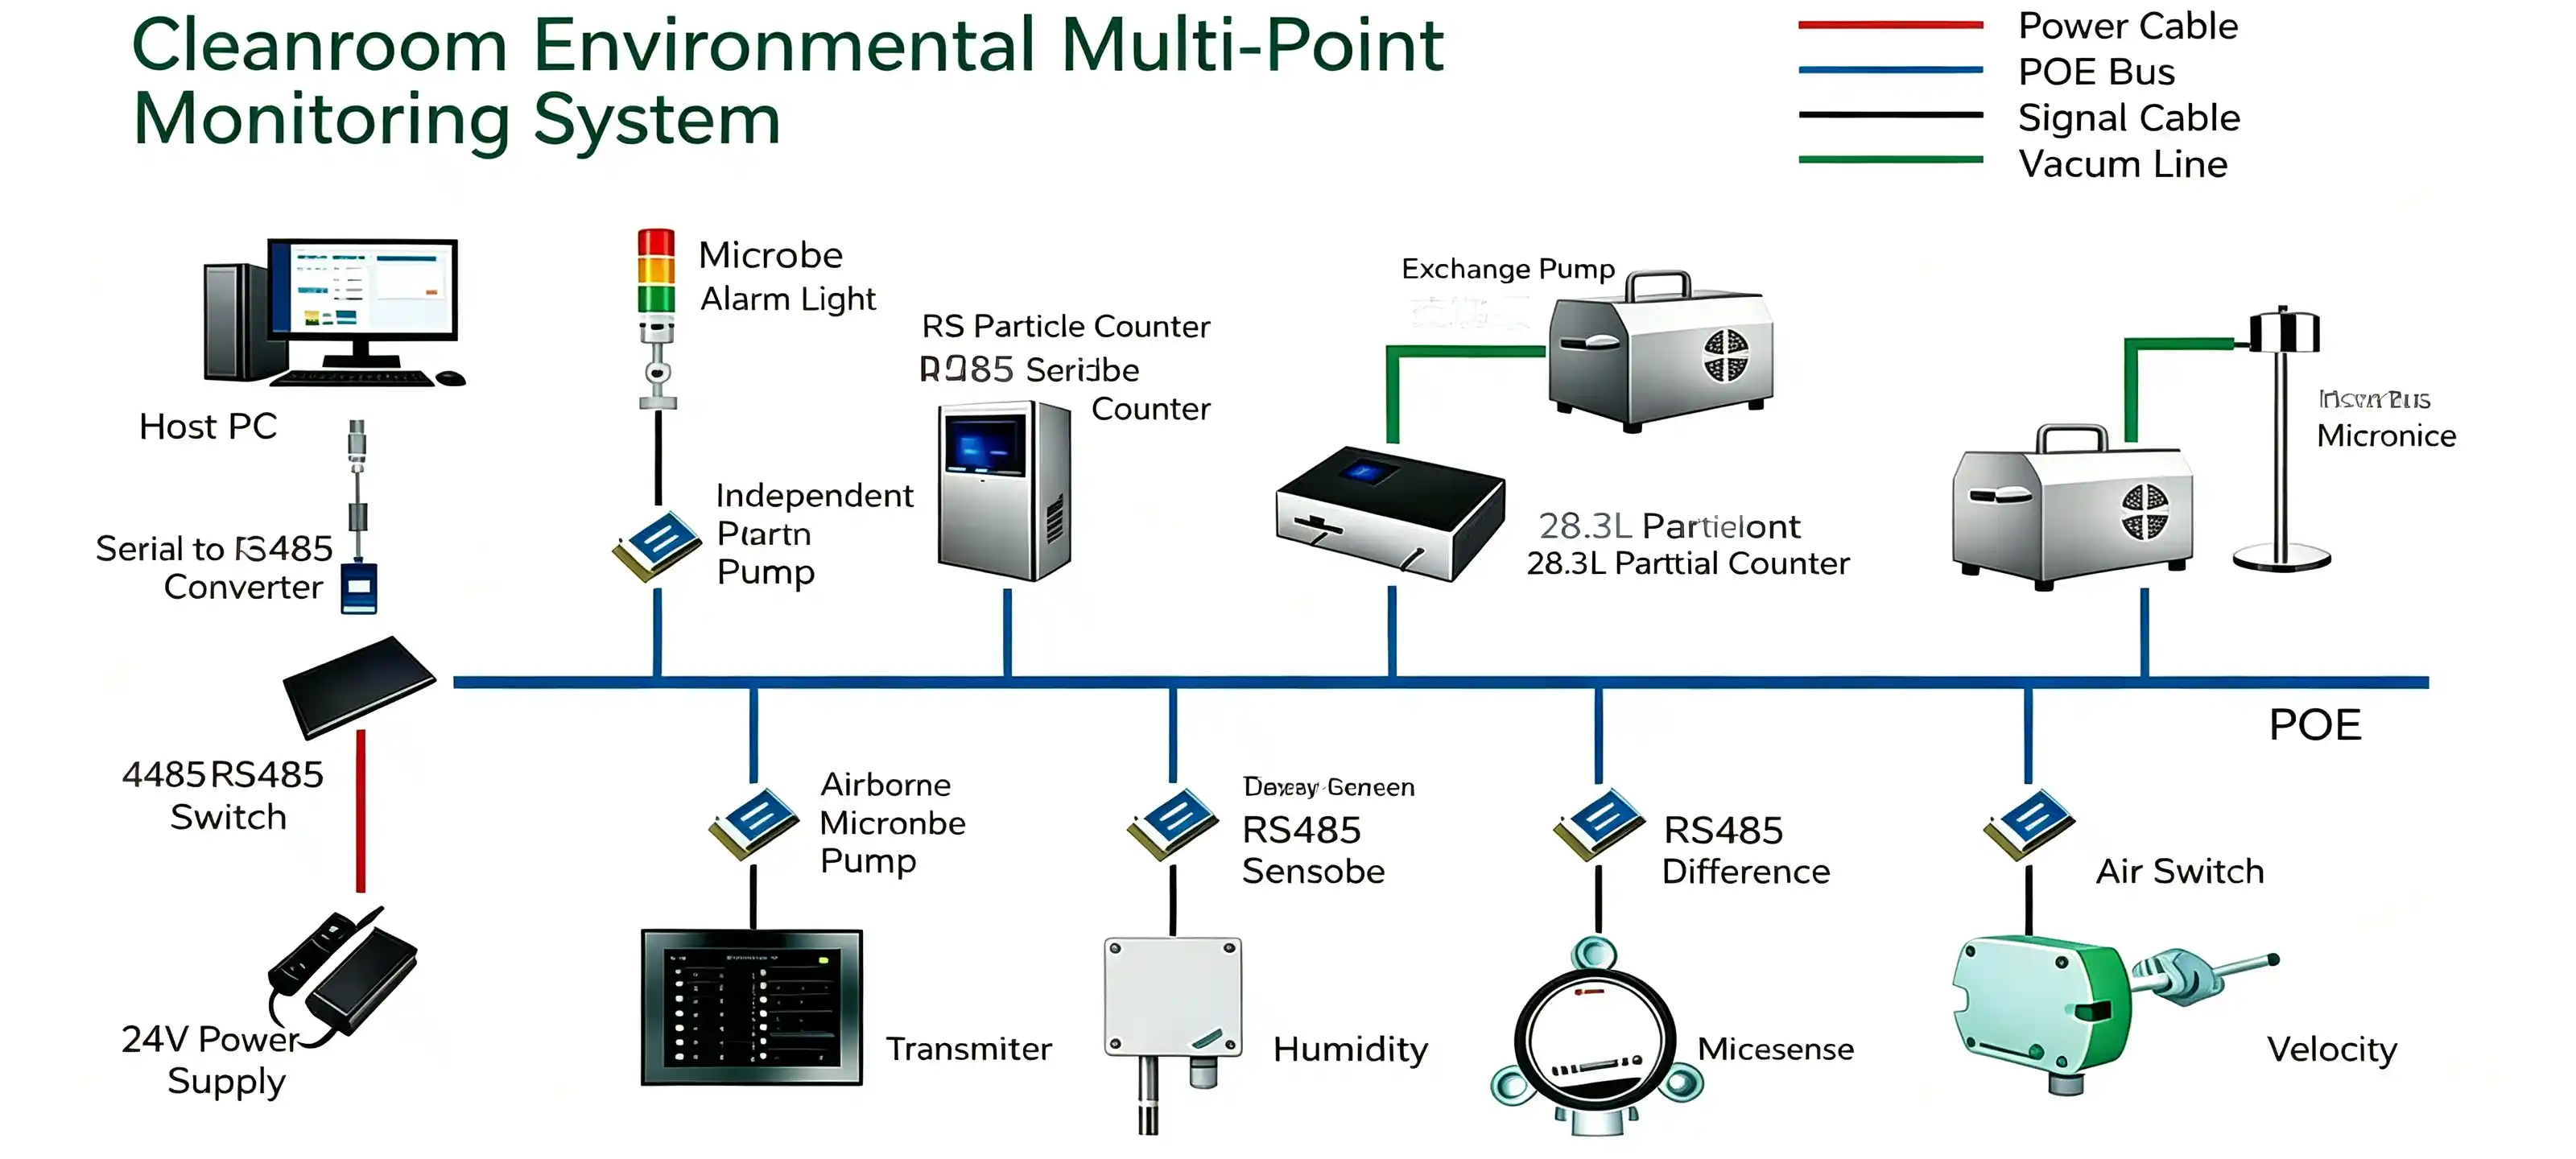
Sampling point → particle counter / remote sensor → communication network → monitoring platform → alert rules → database → trends and reports.
Continuous monitoring does not necessarily mean the system generates a valid compliance conclusion every second. Rather, it continuously acquires and saves data according to a validated sampling cycle.
Advantages
- Captures short-duration particle spikes
- Establishes a contamination timeline
- Automatic audible, email or platform alerts
- Reduces manual transcription
- Supports long-term trend analysis
Risks to manage
- Initial equipment and validation costs
- Fixed sensor positions reduce flexibility
- Long sampling tubes may cause particle loss
- False alarms can cause alert fatigue
- Data systems require access and cybersecurity maintenance
Core comparison table
| Dimension | Manual Sampling | Continuous Monitoring |
|---|---|---|
| Time coverage | Discrete time points | Continuous or high-frequency |
| Instant event recognition | Weak | Strong |
| Location flexibility | High | Primarily fixed points |
| Manual involvement | High | Highly automated |
| Data entry risk | Workflow dependent | Reduces manual transcription |
| Trend analysis | Limited data volume | Suitable for long-term trends |
| Initial investment | Usually lower | Usually higher |
| Typical use | Verification, investigation | Critical zone control, early warning |
| Dimension | Manual | Continuous |
|---|---|---|
| Time coverage | Discrete | Continuous |
| Event recognition | Weak | Strong |
| Flexibility | High | Fixed |
| Manual involvement | High | Automated |
| Data entry risk | Workflow dependent | Reduced |
| Trend analysis | Limited | Strong |
| Initial investment | Lower | Higher |
| Typical use | Verification | Critical control |
ROI analysis: CAPEX vs. OPEX for continuous monitoring
Quality managers often struggle to justify the capital expenditure of a continuous monitoring system. Here is a simplified ROI logic to present to leadership.
5AuEqtXzbgg
ROI calculation framework
OPEX (manual sampling)
- Labor: technician hours × sampling frequency
- False-positive investigation costs
- Batch scrap risk from unmonitored events
CAPEX (continuous system)
- Sensor hardware + installation
- Annual ISO 21501-4 calibration
- Spare sensor pool for hot-swap
Break-even: In most ISO 5 pharmaceutical or semiconductor lines, one avoided batch recall (costing $50k–$500k+) covers the entire continuous monitoring investment. Typical payback period: 12–18 months.
A Deiiang™ client in Southeast Asia avoided a $120k product loss within 6 months of installation by detecting a particle excursion during a night shift that manual sampling would have missed.
When to adopt a hybrid strategy
- Deploy fixed continuous monitoring at critical product exposure points.
- Implement periodic monitoring in lower-risk zones.
- Keep portable devices for investigations and location verification.
- Periodically reassess fixed points using smoke studies, airflow data and historical trends.
How a Continuous Particle Monitoring System Works
Six core components
- Air sampling inlet or isokinetic probe
- Remote particle counter or centralized sampling system
- Sampling tubing and vacuum support
- Communication and control network
- Environmental monitoring software or data platform
- Alarm, reporting and audit trail modulesWhy particle data needs environmental data correlation
- Particle rise + pressure drop: may relate to door opening, leakage or supply/return imbalance
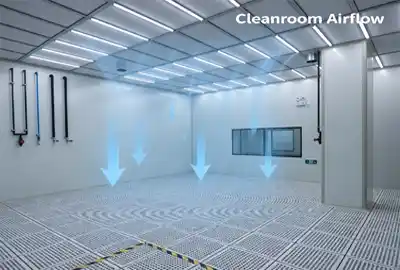
- Particle rise + ffu speed anomaly: may relate to local airflow variation
- Particle rise + equipment start-up: may relate to process emissions
- Particle rise + personnel activity log: may relate to operator or material transfer
- Simultaneous rise at multiple points: may indicate upstream air system or widespread operational events
These relationships help guide investigations. Correlation alone does not establish root cause.
Cleanroom Sensor Placement: Where Should Particle Counters Be Located?
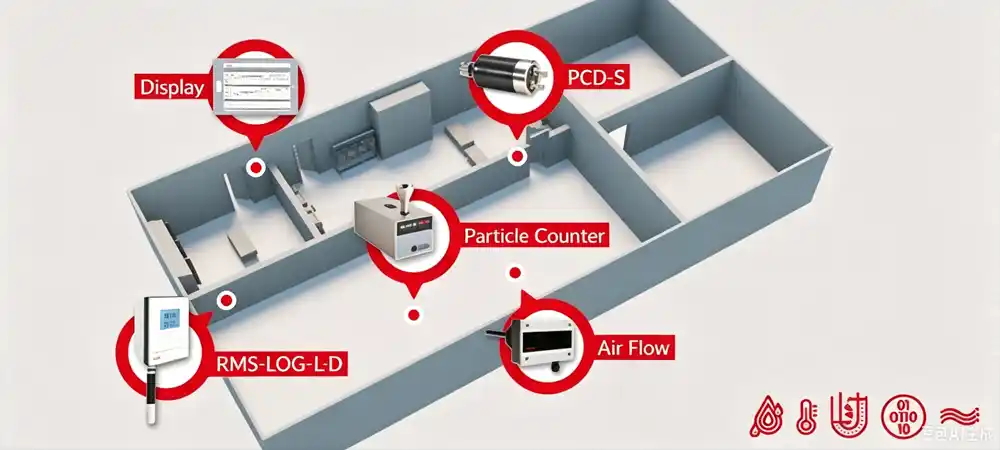
Do not distribute points evenly by floor area
Classification sampling points focus on whether the whole room meets a specific cleanliness grade. Routine monitoring points focus on whether critical processes remain in control. Therefore, classification points are not automatically the best continuous monitoring locations.
Site information to collect before placement
- Room and equipment layout drawings
- Product exposure positions
- Personnel and material flow paths
- FFU, supply and return air locations
- Process equipment exhaust and emission points
- Door, pass-through and buffer zone positions
- Smoke study or airflow visualization results
- Historical deviation and particle trend data
Six high-risk location types to prioritize
- Product or critical surface exposure zones — position probes to reflect the actual product environment without interfering with production or unidirectional airflow.
- Potential emission points of process equipment — near moving parts, loading/unloading positions, equipment openings and high-maintenance areas.
- High personnel activity zones — operators are a significant contamination source. Analyze operator positions, movement paths and actions rather than placing sensors in corners.
- Doors, pass-throughs and zone boundaries — pressure changes and material transfer may introduce contamination. Placement should be risk-based.
- Return airflow, obstruction or potential dead zones — large equipment can block unidirectional flow and create wakes or turbulence. Confirm with airflow visualization.
- Locations with a history of deviations — assess whether equipment status, personnel activity or airflow patterns justify long-term monitoring.
Common placement errors
- Installing directly under HEPA or FFU supply, measuring only the cleanest supply air
- Placing probes too far from actual product exposure points
- Concentrating all probes where cabling is easiest
- Using excessively long or convoluted sampling tubing
- Mounting in positions easily blocked by operators
- Ignoring equipment start-up, maintenance and cleaning states
- Failing to record probe height, direction and coordinates
- Copying point layouts from other projects without completing a local risk assessment
Industry pitfalls: IPA cleaning fog and isokinetic probe orientation
⚠️ Pitfall 1
IPA cleaning fog triggers false alarms
In ISO 5 cleanrooms, operators wiping equipment with isopropyl alcohol (IPA) generate vapor micro-droplets. Optical particle counters misinterpret these droplets as ≥0.3µm particles, triggering false alarms.
Deiiang™ solution: Implement a "Cleaning Mode Hold" in the software layer, or use a recovery-curve algorithm that distinguishes droplet evaporation from solid particle spikes based on rise rate and decay characteristics.
⚠️ Pitfall 2
Isokinetic probe orientation errors
Over 90% of on-site installation errors involve placing the isokinetic probe horizontally or facing downward. In unidirectional (laminar) ISO 5 zones, the probe opening must face vertically upward, directly into the airflow.
Critical rule: The inlet velocity must match the cleanroom downflow velocity (typically 0.36–0.45 m/s) within ±20%. Mismatch causes non-representative sampling and regulatory citations.
Deiiang™ lab test: particle loss by tubing type
Measured at 1 CFM flow rate, 5.0µm particles. Data from Deiiang™ internal engineering validation.
| Tubing Material | Length | Particle Loss (5.0µm) | Recommendation |
|---|---|---|---|
| Antistatic tubing (Hytrel®/Bev-A-Line®) | 1 m | < 3.5% | Preferred |
| Antistatic tubing (Hytrel®/Bev-A-Line®) | 3 m | ~ 8.2% | Acceptable |
| Standard PVC / Tygon tubing | 1 m | ~ 18.5% | Not recommended |
| Standard PVC / Tygon tubing | 3 m | ~ 41.7% | Avoid |
Why Sampling Tubing Design Matters
Tubing length, inner diameter, number of bends and material affect particle transport. Larger particles (≥5.0µm) are more susceptible to settling and electrostatic loss.
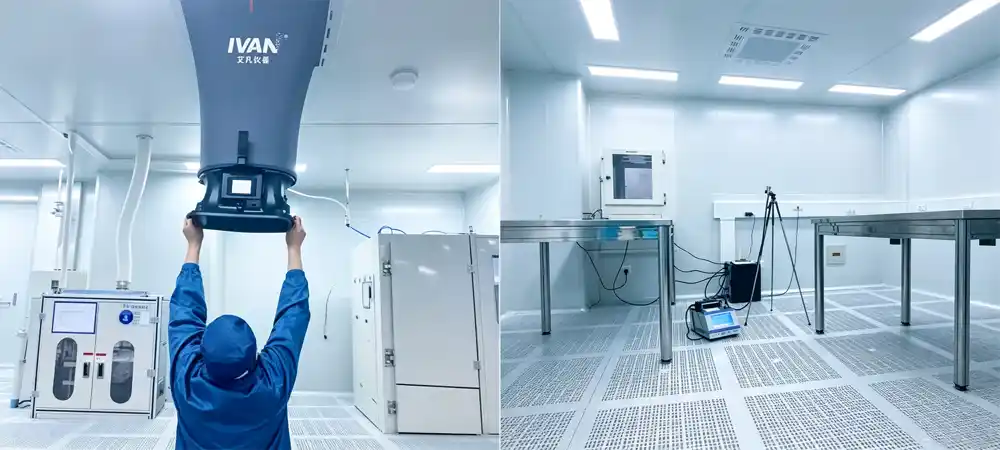
Material selection — the 316L stainless steel or antistatic rule
Do not use standard PVC or Tygon tubing. These materials generate static charge, causing up to 50% loss of 5.0µm particles through electrostatic attraction. Deiiang™ recommends 316L stainless steel or antistatic lined tubing (e.g., Hytrel® or Bev-A-Line®) for all critical sampling lines.
Bend radius — never less than 15 cm
Each sharp bend creates inertial impaction losses. The minimum bend radius must be 10–12× the tubing outer diameter. For a 1/4″ (6.35 mm) OD tube, that means a radius of at least 6.35 cm, but in practice Deiiang™ engineers specify > 15 cm for all bends to ensure reliable 5.0µm particle transport.
Length control — every meter adds 5–8% loss
At 1 CFM flow rate, total tubing length should not exceed 2–3 meters for 5.0µm particle monitoring. For 0.5µm particles, the tolerance is slightly higher but still limited. Deiiang™ field data shows: each additional meter of tubing increases 5.0µm particle attenuation by 5% to 8%.
🔬 Particle Loss Estimator
Estimate particle attenuation based on tubing length, material and target particle size.
Estimated particle loss: —
Five-step placement process
Step 1: Define critical process and product risk — identify exposure stages and potential impact.
Step 2: Analyze airflow — review FFU layout, supply/return paths, equipment obstruction and smoke studies.
Step 3: Identify candidate points — prioritize critical exposure, emission sources and boundary risks.
Step 4: Perform on-site verification — compare candidate point responses under static, dynamic and typical operational conditions.
Step 5: Document and periodically review — incorporate basis into the monitoring plan and reassess after layout or process changes.
Turning Particle Counts into Automated Cleanroom Data
Automated workflow from detection to deviation processing
Particle detection → data validation → time-stamped record → alert threshold check → operator notification → event acknowledgement → investigation → CAPA or closure → trend report.
Alert strategy should not use a single upper limit
- Informational: observation without immediate formal deviation
- Alert state: trend deviating from normal baseline
- Action state: formal response and investigation triggered
Specific limits must be established by the organization based on risk, historical data, process requirements and applicable regulations.
How to reduce alert fatigue
- Do not assign the same alert level to all short-duration fluctuations
- Consider duration, consecutive exceedances and correlated parameters
- Distinguish between production, cleaning, maintenance and shutdown modes
- Periodically analyze recurring alerts
- Implement approval and version control for alert rule changes
Sensor calibration and hot-swap maintenance
Particle counters must be calibrated annually per ISO 21501-4 using traceable standards. During calibration, the sensor is removed from service — but production cannot stop.
Deiiang™ recommends a hot-swappable sensor architecture with a pre-validated spare pool. Each spare sensor is factory-calibrated and verified against the existing system baseline, allowing immediate replacement without data gaps or requalification.
Critical rule: never leave a monitoring point inactive for more than 4 hours without a backup plan. Regulatory auditors will question any unmonitored production period.
Audit-friendly data records should include
- Date and unified timestamp
- Sensor ID and location
- Particle size channels and sample volume
- Raw counts and calculated results
- Equipment status
- Calibration status
- Alert acknowledgement records
- User operation logs
- Data modification and configuration change records
- Deviation, investigation and closure information
The Environmental Control Layer Behind Stable Particle Data
Why installing particle counters alone is not enough
Continuous monitoring detects anomalies but cannot actively stabilize the cleanroom environment. A true control loop requires:
- FFU operational stability
- AHU/MAU supply control
- Room pressure differential
- Temperature and humidity
- air change rate and return balance
- Filter condition monitoring
- Door interlock and operation modes
Role of Deiiang™ FFU in the monitoring architecture
- DC control series FFU
- Supports centralized or partitioned control
- 485 interface or network interface for management system integration
- Monitor or adjust fan operating status
- Control logic can be organized by zone
- Provides basis for temporal correlation between particle data and equipment operation
(All FFU parameters must be verified against official Deiiang™ data sheets.)
Role of Deiiang™ Recirculation AHU and MAU
- Variable-frequency Recirculation AHU
- EC fan wall design
- Full DC flexible scroll inverter compressor
- Constant temperature and humidity control
- Variable-frequency operation reduces environmental fluctuations from frequent start-stop
- Operational data can be integrated into the central monitoring architecture
Particle counters reveal the event. Integrated FFU, AHU and environmental data help explain why the event occurred.
Deiiang™ Project Case Study — ISO 5 semiconductor cleanroom Upgrade
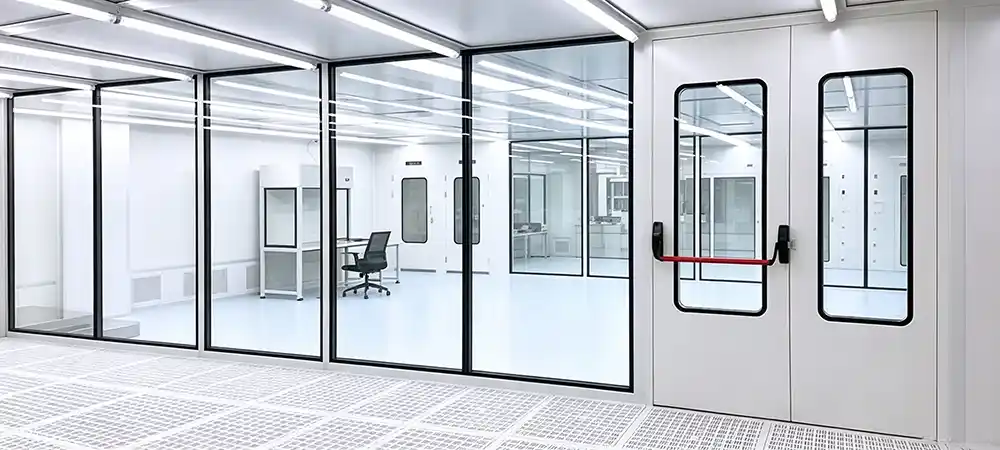
Project background
- Region: Southeast Asia (specific country per authorization)
- Industry: Semiconductor or precision electronics manufacturing
- cleanroom grade: ISO 5 critical production zone
- Scope: Cleanroom environmental system upgrade
- Deiiang™ supply scope: FFU, AHU/MAU, control interfaces, on-site installation or commissioning
- Client goal: Improve environmental stability and enhance monitoring data correlation
Project challenge 1 — complex equipment layout affecting airflow
Large production equipment obstructed unidirectional airflow. Installing FFUs or sensors evenly by floor area would not adequately reflect local risks around equipment. The team needed to evaluate equipment height, maintenance space, operator positioning and return air paths.
Project challenge 2 — multi-system data silos
Particle counts, FFU controls, AHU operation and room environmental parameters came from different systems. Without unified timestamps or communication protocols, deviation investigation required significant manual effort.
Project challenge 3 — high production continuity requirements
The upgrade had to minimize downtime and avoid impacting the existing clean zone during installation. The plan required advance scheduling of equipment zones, construction sequence, commissioning windows and contingency measures.
Deiiang™ solutions
Solution 1 — FFU zoning and variable-frequency control: Control zones defined by process areas; DC control FFUs; 485 or network interface for status communication; provision for equipment status and environmental data correlation.
Solution 2 — stable air handling architecture: Variable-frequency Recirculation AHU or MAU configuration; EC fan wall design; minimized unnecessary start-stop; integrated temperature, humidity and pressure control.
Solution 3 — risk-based sensor placement: Critical zones identified using process layout; candidate points determined with airflow direction; avoided "optimistic" readings directly under clean supply outlets; position representativeness confirmed through on-site testing.
Solution 4 — automated data integration: Unified equipment IDs and point names; synchronized system time; correlated FFU, AHU and environmental status with particle events; established alert and reporting logic.
Commissioning and validation flow
Design review → equipment installation → communication check → airflow balancing → HEPA integrity testing → environmental testing → sensor location verification → alarm challenge test → user training → handover.
Project results (verified data)
- Average deviation investigation time reduced from 18 hours to 25 minutes
- False alarm rate reduced by 65%
- Successfully passed third-party ISO 14644-2 on-site audit on first attempt
- Manual data entry time reduced by 80%
- FFU operational status visualized for all 120 installed units
- Alert notification time shortened to under 90 seconds
How to Choose a Particle Monitoring Strategy for an ISO 5 Facility
Eight questions to answer first
- Is the product openly exposed to the environment?
- Could a short-duration particle event affect the product?
- Are there clear data gaps in existing manual sampling?
- Which locations are the most critical process points?
- Is real-time alerting required?
- Is an electronic audit trail needed?
- Can the system communicate with BMS, EMS, FFU or AHU?
- Who is responsible for calibration, maintenance, alerts and data review?
Continuous monitoring equipment selection metrics
- Detectable particle size channels
- Flow rate and sampling mode
- Data update and storage method
- Tubing compatibility
- Communication protocol
- Alert output capabilities
- Calibration and maintenance requirements
- Software permissions and audit trail
- Data export format
- System redundancy and offline recovery
- Cleanroom installation and disinfection compatibility
- Hot-swappable sensor architecture with spare pool verification
When not to blindly expand continuous monitoring
- Process risk is very low in the zone
- Data will not influence any decisions
- There are not enough personnel to handle alerts
- Points have not been assessed for risk
- Equipment maintenance and calibration resources are insufficient
- Only to "appear more digital"
More monitoring points do not automatically mean better compliance. Explainable, maintainable and risk-relevant data matters more.
Implementation Roadmap
Phase 1 — Risk assessment: Define product risk; collect room and process layout; review deviation history; establish user requirement specification.
Phase 2 — Conceptual design: Determine continuous, manual or hybrid approach; develop candidate points; define system interfaces; initial alert logic design.
Phase 3 — Detailed engineering: Confirm equipment models; design sampling tubing; determine power and network; define data naming, storage and permissions.
Phase 4 — Installation and integration: Install sensors and probes; integrate with FFU, AHU or environmental systems; verify time synchronization; complete communication testing.
Phase 5 — Testing and verification: Calibration verification; flow and response testing; alarm challenge testing; data retention and permission testing; point representativeness review.
Phase 6 — Operation and continuous improvement: Periodic trend review; evaluate false alarms; check data gaps; reassess after process or layout changes; update monitoring plan regularly.
Frequently Asked Questions
Does ISO 14644-2 require continuous particle monitoring?
ISO 14644-2 emphasizes a risk-based monitoring plan. It should not be interpreted as requiring identical 24/7 continuous particle monitoring configurations for all cleanrooms and zones. The approach should be based on cleanliness grade, process risk, critical locations and applicable regulatory requirements.
Is manual particle sampling still acceptable for an ISO 5 cleanroom?
Manual sampling remains acceptable for classification support, periodic verification, investigations or low-risk zone monitoring. Sufficiency depends on monitoring purpose, sampling frequency, point representativeness and data risk.
How many particle sensors does an ISO 5 cleanroom need?
The number of routine monitoring points is not determined solely by floor area. It should be based on critical process locations, product exposure, personnel activity, airflow patterns and deviation history. Classification point count and routine fixed monitoring point count are not necessarily the same.
Where should a cleanroom particle counter be placed?
Typically near positions representative of critical product or process exposure, while avoiding interference with unidirectional airflow and production operations. Final location should be confirmed with airflow studies, process risk assessment and on-site testing.
Should a particle sensor be installed directly under an FFU?
Generally not, if the sole purpose is to obtain lower readings from clean supply air directly under the FFU outlet. That position may not represent the actual product exposure environment. The final decision should be based on monitoring purpose and risk assessment.
Can continuous monitoring replace cleanroom classification?
Not by default. Routine monitoring and cleanroom classification serve different purposes and should be performed separately according to applicable standards and company procedures.
What data should be integrated with particle counts?
FFU operating status; room pressure differential; temperature and humidity; AHU/MAU operating parameters; door status; process equipment status; personnel and material activity logs.
How often should particle monitoring data be reviewed?
Real-time alerts require immediate response per procedure. Trend data may be reviewed daily, weekly, monthly or quarterly based on risk. A special review should be conducted after significant changes or deviations.
What causes false particle alarms?
Common causes include: improper probe placement; cleaning or maintenance activity; sampling tube contamination; flow rate anomalies; communication errors; overly sensitive alert logic; operating modes not properly distinguished; and IPA cleaning vapor as described above.
Conclusion — From Particle Counts to Actionable Cleanroom Intelligence
Continuous monitoring closes the data gaps left by manual sampling and helps capture short-duration particle events. But manual sampling has not lost its value. ISO 5 projects typically need a combination of continuous and periodic sampling based on monitoring purpose.
Deiiang™ provides a stable environmental foundation and data integration conditions for cleanroom particle monitoring around FFU, AHU/MAU, environmental control and communication interfaces.
Planning an ISO 5 cleanroom monitoring upgrade?
Share your process layout, FFU arrangement and critical operation points with Deiiang™ for a preliminary airflow and monitoring integration review.
Request a Cleanroom Monitoring ReviewDiscuss Your ISO 5 ProjectDownload the Sensor Placement Checklist
References
- iso 14644-1:2015 — Cleanrooms and associated controlled environments, Part 1: Classification of air cleanliness by particle concentration
- ISO 14644-2:2015 — Cleanrooms and associated controlled environments, Part 2: Monitoring to provide evidence of cleanroom performance related to air cleanliness by particle concentration
- iso 14644-3:2019 — Test methods
- ISO 21501-4:2018 — Determination of particle size distribution — Single particle light interaction methods
- EU GMP Annex 1: Manufacture of Sterile Medicinal Products (2022/2023)
Designer: Jason.peng · Deiiang™ · All product specifications subject to official Deiiang™ data sheets.