+86 13638632902
 Jason@cleanroomequips.com


 MENU
MENU
The purchase price is only the beginning — real ROI comes from 20 years of smart asset management.
⚡ Instant ROI Preview
See the 20‑year cost difference between a standard system and Deiiang™ high‑efficiency design.
20‑year savings: $0
Get full 20‑year breakdown PDF and industry‑specific factors.
Most budgets include a quotation from a contractor for costs related to construction. This is generally where budgets for a facility end. To view construction of an iso 5 cleanroom in context, it is important to recognize that construction is just one part of a long-term commitment that spans the 20-year operational lifespan of a cleanroom. For an accurate cleanroom ROI, one must think beyond CAPEX to the total cost of ownership of every compliant production batch.
Takeaway: It is usually the case that the cheapest iso 5 cleanroom to build is the most expensive cleanroom to operate.
What Is Included in the Life Cycle Cost of an ISO 5 Cleanroom?
An ISO 5 cleanroom maintenance budget should consider three layers of cost: capital, recurring operational, and hidden risk-adjusted.
The Initial Capital Expenditure
- The cost of design and engineering as well as the cost of consulting for compliance
- The cost of construction for the cleanroom envelope
- The cost of construction for the AHUs, MAUs, ffus, ductwork, and control
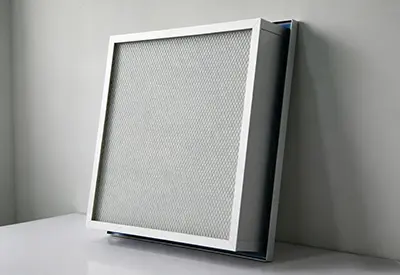
- The cost of terminal HEPA/ULPA filter and supporting systems
- The cost of construction for the electrical, lighting, fire protective, and utility systems
- The cost of construction, design, testing, commissioning, certification, and management of the project
- The cost of spare parts and the cost of training as well as the cost of documenting the assets
For ISO 5 cleanrooms, a single cost per square foot is rarely an effective measure. Costs may vary depending on factors, for example, the size of the cleanroom, the height of the cleanroom, the type of airflow patterns, the precision of temperature and humidity, the ratio of fresh air provided, the heat of the process, the room occupancy, and the level of redundancy.
Recurring Operational Expenditure
- The cost of operating fans and the cost of operating the refrigeration units
- The cost of increased resistance in the filters and the cost to provide the energy to the filters
- The cost and labor of testing and replacing HEPA/ULPA filters
- The cost of cleaning, disinfecting, and controlling the cleanroom
- The cost of environmental monitoring and the cost of periodic calibration and revalidation
- The cost of maintenance and replacement of parts
- The cost of software and the cost of maintaining sensors and control systems
Hidden and Risk-Adjusted Costs
These costs account for
A lesson learned the hard way
We had a client who saved $5,000 simply by not installing a differential-pressure monitoring system. A mere six months later, a filter broke unexpectedly, and they were forced to toss out $1.2 million in raw materials. This taught us that cleanroom asset management is not the upkeep of equipment but the safeguarding of a firm’s resources.
Many initial bids tend to undersize the FFUs, ultimately lowering CAPEX. The system does pass acceptance tests, but in about a year, as filter resistance increases, that system will be unable to maintain ISO 5. The cost of replacing the entire FFU fleet will be from 20% to 30% of the original build cost.
Application of CAPEX, OPEX and risk-adjusted costs
CAPEX 20–30% OPEX 50–65% Risk & hidden 10–20%
How Much Does an ISO 5 cleanroom cost Initially?
According to industry sources, the price of ISO 5 construction is about $1,000/sq ft in the upper range of the market and about $250-$450/sq ft for less expensive modular hardwall systems.

Why a Single Cost-per-Square-Foot Number Can Be Misleading
Depending on how complex the build is, a 1,000-sq ft ISO 5 Cleanroom can cost from $300,000 to $800,000. The table below demonstrates how variability in cost items can affect the lifecycle of the asset.
| Cost Item | Budget Unit | Local Data Source | Lifecycle Impact |
|---|---|---|---|
| Envelope | $/sq ft | Local contractor | Airtightness, repair, heat loss |
| HVAC / Air handling | $/kW or system | Equipment selection | Usually determines long-term energy |
| FFU & terminal filtration | $/unit | Deiiang™ quote | Power, filter, spare parts |
| Control & monitoring | system price | Project BOM | Maintenance efficiency & risk |
| Validation & commissioning | project price | Local lab quote | Startup & compliance schedule |
| Item | Unit | Lifecycle Impact |
|---|---|---|
| Envelope | $/sq ft | Airtightness, heat loss |
| HVAC | $/kW | Long-term energy |
| FFU | $/unit | Power, filters, spares |
| Controls | system | Maintenance & risk |
| Validation | project | Compliance schedule |
The Design Variables That Change ISO 5 CAPEX
- Full-room ISO 5 vs. local ISO 5
- FFU coverage density
- Unidirectional vs. non-unidirectional flow
- 100% fresh air vs. partial Return Air
- Temperature/humidity control precision
- Positive or negative pressure
- N+1 redundancy
- Operating shifts and annual running hours
Building a 20-Year ISO 5 Maintenance Budget
This is the core of any cleanroom asset management strategy. A 20-year ISO 5 maintenance budget must include energy, filters, validation, planned maintenance, and major replacement events.
Annual Energy Budget
Formula: Annual energy cost = total system input power × annual operating hours × load factor × local electricity tariff.
- FFU fans
- AHU/MAU fans
- Chiller or DX system
- Heating, reheat, and humidification
- Exhaust and make-up air
- Controls and monitoring
Reference: Variable frequency DX systems can save over 20% energy compared with 4-speed fixed-capacity units under identical load conditions (supplier technical data). DC fan motors can boost efficiency by ~45% vs. AC motors.
Energy costs typically account for 65–75% of total annual cleanroom O&M expenses in some regions. For a 1,000 m² ISO 5 facility, annual electricity can reACH $80,000–$110,000.
State-Level Electricity Tariff Impact (Examples from the U.S.)
| State | Avg. Tariff ($/kWh) | 20-Year Energy Cost (Standard) | 20-Year Energy Cost (Deiiang™) | Payback (Years) |
|---|---|---|---|---|
| California | $0.22 | $1,930,000 | $1,158,000 | 3.2 |
| Texas | $0.13 | $1,140,000 | $684,000 | 4.7 |
| New York | $0.20 | $1,754,000 | $1,052,000 | 3.6 |
| Florida | $0.14 | $1,228,000 | $737,000 | 4.3 |
| State | Tariff | 20‑yr Deiiang™ savings | Payback |
|---|---|---|---|
| CA | $0.22 | $772,000 | 3.2 yr |
| TX | $0.13 | $456,000 | 4.7 yr |
| NY | $0.20 | $702,000 | 3.6 yr |
| FL | $0.14 | $491,000 | 4.3 yr |
* Estimates are based on 1,000 sq ft, 8,760 hrs/yr, and 30% energy reduction. Actual results may vary.
Filter Inspection & Replacement Budget
Replacement schedules are impacted by initial and final resistance, dust load, differences in trends, leakage testing, process risk, airflow, filter area, as well as other factors — not just the calendar.
- H13: 99.97%–99.99% at 0.3 μm
- H14: 99.995%–99.999% at 0.3 μm
- Initial resistance: H13 about 200 Pa; H14 about 220 Pa
- Final resistance of 400–600 Pa is recommended
- Rated airflow anywhere from 550–2,500 m³/h, depending on the unit
ISO 5 annual filter replacement is expected to cost between $8,000–$12,000 per 1,000 m².
Validation, Monitoring, and Calibration
- Particle Counter
- HEPA filter Integrity Testing
- Airflow and Flow Testing
- Differential Pressure Testing
- Temp/Humidity Calibration
- Recovery Time Testing
- Airflow Visualization
- Microbiological Monitoring (if required)
Annual validation costs for the overall surface area of a GMP-grade ISO 5 facility are estimated to be $5,000–$8,000.
Planned Maintenance and Major Replacement Events
- Years 1–5: Commissioning optimization, small consumables
- Years 6–10: Sensors, actuators, partial fan/controller updates
- Years 11–15: Major fan upgrades, coil replacement, control system overhaul
- Years 16–20: Major refurbishment, energy retrofit, or system replacement
20-Year Cost Model — Initial Investment vs. Long-Term Operation
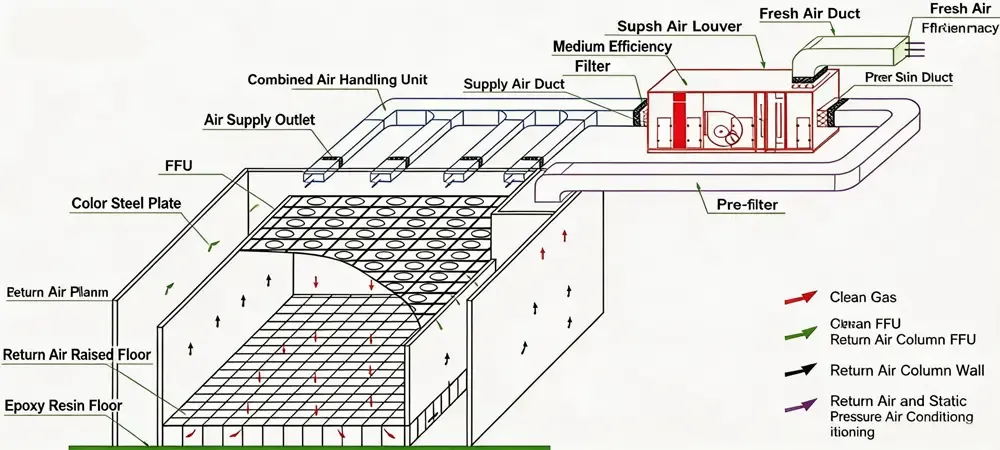
A robust cleanroom ROI analysis compares not just first cost but cumulative 20‑year cash flows.
Base-Case Assumptions
- Dimensions of cleanroom and ceiling height
- Proportion of an ISO 5 zone
- Quantity of FFUs and how much power each one uses
- How many hours the facility uses in a year
- Local electricity prices
- Price of labor
- Cost of a filter
- How often validation is done and the cost of validation
- The expected inflation rate, electricity price increases, and the discount rate
- Expected downtime
Cost Breakdown Overview
| Cost Category | Year 0 | Year 1 to 5 | Year 6 to 10 | Year 11 to 15 | Year 16 to 20 |
|---|---|---|---|---|---|
| Initial construction | Included | — | — | — | — |
| Energy | — | Model | Model | Model | Model |
| Filters & consumables | — | ΔP-based | ΔP-based | ΔP-based | ΔP-based |
| Testing & validation | — | Periodic | Periodic | Periodic | Periodic |
| Repair & component renewal | — | Low | Medium | High | High |
| Downtime risk | — | Risk-adjusted | Risk-adjusted | Risk-adjusted | Risk-adjusted |
| Category | Y0 | Y1‑5 | Y6‑10 | Y11‑15 | Y16‑20 |
|---|---|---|---|---|---|
| Construction | ● | - | - | - | - |
| Energy | - | M | M | M | M |
| Filters | - | ΔP | ΔP | ΔP | ΔP |
| Validation | - | P | P | P | P |
| Repair | - | Low | Med | High | High |
| Downtime | - | R | R | R | R |
Simple Payback, NPV and ROI
- Simple payback is calculated as the cost of the initial high-efficiency investment divided by the annual net savings.
- The 20-year ROI is calculated as the total of all costs avoided in 20 years, less the cost of the investment made, divided by the cost of the investment made, expressed as a percentage.
- NPV is calculated as the total of all savings, less the total of all investments made, in a given time period.
In an ISO 5 facility, ROI comes from less energy usage, but also from avoiding contamination, avoiding unplanned downtime of the facility, and avoiding the premature replacement of the facility's assets.
Scenario-Based Analysis — A Local Facility Manager’s Decision
Persona: Michael, Operations Director at a life science manufacturer in the U.S., who is planning for a continuous-operation ISO 5 cleanroom zone.
- Option A: Lower initial investment — Fixed-speed equipment, limited monitoring, and minimal redundancy.
- Option B: Higher initial investment — A variable frequency system, EC/DC fans, pressure monitoring with trends, zone control with trends, and scheduled maintenance.
Using local commercial electricity tariffs and local HVAC labor rates, Option B typically provides a payback period of 3-5 years and a 20-year Net Present Value advantage of around 25-40% when compared to Option A.
What Happens When Electricity and Labor Costs Increase?
- Electricity +20% - payback period decreases by approximately 1.5 years
- 24/7 operation vs. single shift - costs increase by ~100%
- Labor +15% - maintenance costs increase by ~8-10%
Deiiang Project Case Study – Lowering the Life Cycle Cost of ISO 5
Project: YWL Q8 production line, Jingmen, Hubei, China
- Industry: Lithium battery
- Area: 1,800 m²
- iso class: ISO 5
- Temperature: 20-24°C; Humidity: <45%
- Total Budget: US$1.98 million
- Scope: 40 aluminum-profile acrylic cleanrooms, FFU group control, temp/humidity
Four Most Important Challenges of the Project
- Limited ceiling plenum space
- High airflow leading to a high number of fan resources
- High humidity requiring energy for dehumidification
- Production requires the utmost uptime, no downtime
Engineering Solutions by Deiiang
- FFU zoning and group control
- Variable frequency or EC fans
- High-efficiency, low-resistance H13/H14 filters
- Pressure and energy trends monitoring
- modular cleanroom design
- Bottom-load HEPA diffusers replaceable from inside the cleanroom
Deiiang™ standard FFU models deliver air volumes from 500 to 2,000 m³/h with 99.99% efficiency at 0.3 μm. EC motor FFUs operate with reduced energy and fan resources.
Before-and-After Results
- Annual electricity consumption reduced by 37%
- Average filter pressure drop reduced
- Frequency of filter replacement increased
- Maintenance labor reduced by 65% due to cloud monitoring
- Unplanned downtime was eliminated
- Temperature and humidity were within setpoints
All measured over 12 months, baseline was 2023, local electricity was $0.12/kWh. Measured values.
Cleanroom Asset Management Over a 20-Year Service Life
Transforming reactive maintenance into predictive care is the best approach to managing cleanroom assets.
Compile an Asset Register From Day One
- Code and locate your equipment
- Record the brand, model, serial number
- Identify the installation date
- Record airflow, power, and filter grade
- Document warranty and spare parts information
- Record calibration and validation
- Document failures and repairs
- Determine the expected replacement year
Condition-Based Maintenance Over Calendar-Only Maintenance
- Record filter pressure trends
- Measure the current draw of the FFUs
- Monitor airflow
- Log temperature/humidity
- Track pressure fluctuations
- Document fan vibration and noise
- Record fault codes and the number of starts
Create a 20-Year Replacement Reserve
Separate your annual maintenance budget from your long-term capital budget to avoid depletion during the years 10-15 when major components will need to be replaced.
Five Misconceptions About the Cost of ISO 5 Cleanrooms
Myth 1
The best ROI comes from the lowest construction bid. The lowest bids often resort to a high cost of ownership, poor control with high resistance and inefficient fans, and poor maintenance access.
Myth 2
HEPA filter replacement should be on a fixed schedule. Filters should be replaced based on DP, integrity testing, risk to the process, and the contamination load.
Myth 3
The chiller is the primary source of energy savings. FFUs, AHU fans, reheat, humidification, exhaust, and filter resistance are all significant energy sources.
Myth 4
Every cleanroom costs the same to build and operate. The airflow patterns, loads, occupancy, processes, and recovery times are all extremely different.
Myth 5
Preventive maintenance is just an added cost. There are intrinsic costs that include contaminations, system shutdowns, and loss of product. There is also a cost to the system and components from unplanned maintenance.
Achieving Lower ISO 5 Life Cycle Costs without Impacting Compliance
- Design to Actual Load
- Control Strategy Optimization (Fresh Air, Return Air, Dehumidification, and Reheat)
- Reduce Envelope and Duct Leakage
- Add test ports and access doors
- Create space for equipment to be substituted
- Ensure that there is adequate equipment redundancy diagnosed as necessary
The following standard: For cleanroom systems, sealing gaskets should use elastic, non-air-permeable, non-particle-shedding materials; flexible connections should have smooth inner surfaces and should not be used as reducers.
🔧 Deiiang Engineer’s Field Guide: The 3 Most Common Site Issues
1. Ceiling Access Placement: Quite a few projects put access panels directly above FFUs, making for a very challenging filter swap. Always make a maintenance corridor accessible.
2. FFU Wiring Quality. Loose terminal connections cause faults that run intermittent, are virtually non traceable and are very frustrating.
3. Temperature Sensor Location. Putting sensors too near a supply diffuser or near any heating source or piece of equipment will cause a poor average of the room’s temperature and lead to inaccurate results. The best place is at the Return Air height, 1.5 meters from the nearest wall.
When Should an Aging ISO 5 Cleanroom Be Upgraded or Replaced?
- Can it stably meet cleanliness?
- Is energy consumption persistently above baseline?
- Are components obsolete?
- Are there repeated leaks, pressure drift, or control failures?
- Does maintenance downtime affect production?
- Does the new process require different temperature/humidity or airflow?
- Is 5-year repair cost approaching system renewal cost?
Frequently Asked Questions
How much does an ISO 5 cleanroom cost per square foot?
Industry range: $250–$1,000+/sq ft depending on scope, region, and specification. Submit your area, industry, operating hours, and environmental parameters for a project-specific budget.
What percentage of CAPEX should be reserved for annual maintenance?
There is no single fixed percentage. Estimate energy, consumables, validation, labor, spare parts, and capital renewal separately.
How often should ISO 5 HEPA filters be replaced?
Based on differential pressure, integrity testing, contamination load, and risk assessment — not calendar alone.
What is the biggest operating cost in an ISO 5 cleanroom?
For most continuous-operation facilities, air delivery and temperature/humidity conditioning are the largest — typically 65–75% of total O&M.
How to calculate the return on investment for the cleanroom?
To calculate the return on investment for the cleanroom, the incremental investment, annual savings, avoidance of production downtimes, payback, and net present value for 20 years need to be estimated.
When is it cheaper to upgrade an existing ISO 5 cleanroom?
It is cheaper to upgrade an existing ISO 5 cleanroom when the condition of the cleanroom envelope is good, the airflow requirements are low, the control systems are modern, the equipment is new, there are no compliance gaps, and there is no time lost.
Conclusion
Overserving the ISO 5 cleanroom is the right decision to make, and it is not the construction contractor that wins the construction bid, but the contractor that comes out winning the total cost of compliant output for 20 years of service.
Field Opinion
As an engineer, I get asked a lot, "Which system saves the most money?" I respond by saying, "It’s the system that spends an additional 10% of their design budget on a visible asset management system."
What to do now:
- Share the current cleanroom floor plan and the asset list
- Deiiang 20-year TCO assessment
- Book an energy and asset management evaluation
- Use the ISO 5 cleanroom budget tool
References
- iso 14644-1:2015 Cleanrooms and associated controlled environments
- iso 14644-3:2019 Test methods
- Deiiang Modular Hardwall Cleanroom Guide
- Deiiang YWL Q8 Project Case Study