+86 13638632902
 Jason@cleanroomequips.com


 MENU
MENU
A modular cleanroom is not simply a cardboard box with filters built into the ceiling. It is a system that requires coming up with three engineering solutions, which are layout design, HVAC air handling system and ffu ceiling grid. If these three elements are not considered simultaneously in the proper way, the cleanroom will not meet its ISO standards when running. This guide includes descriptions of all three elements of modular cleanroom design — layout planning, cleanroom HVAC design which allows air movement and conditioning, and cleanroom ffu design which gets filtered air from the ceiling to the air-handling unit.
Once the three mentioned elements are designed well enough, facilities would save money on cleaning operations. According to the experience of Deiiang™ with over 60 completed projects in the field of modular cleanroom, facilities which successfully integrated layout, HVAC and FFU design in one project cycle demonstrated savings of over 31–34% of 10-year operational costs compared to the facilities which designed the elements separately.
In this guide you will find: layout logic based on ISO 14644 standards, airflow and pressure design calculations for modular HVAC systems, FFU coverage calculations for iso 5–iso 8 cleanrooms, Deiiang's case study and practical audit of clean fixtures.
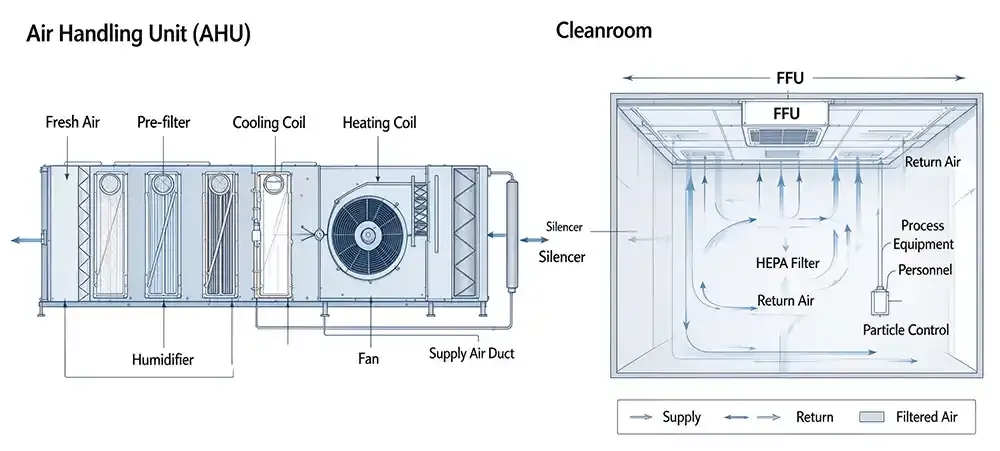
HVAC and FFU position along with layout needs to be thought of as one design issue rather than three different purchases.
Strategic Layout Design
Layout is where one can either gain or lose money on modular cleanroom layout design. After designing the module for every FFU, the designer has to work with three kinds of flows — of people, materials, and air — so that every area gets designated its classification that goes along a continuum and is not treated like separate islands. A design that makes clean air pass a gowning exit or a cart transfer hatch will completely fail to fulfil the necessary particle count no matter how much filtration is applied at the exit side.
The rule of thumb is that contamination travels along with materials and people, so space should be arranged in a way that makes the dirty path longer and the clean one shorter. In practice, it means placing the cleanest zone deep inside the module, away from exterior walls and personnel entry.
Separation of Flows of Personnel, Materials, and Air
The layout must be done in such a way that the three kinds of flow stay separate. The most common design involves a single airlock for personnel on the side of personnel along with a material or pass-through airlock on the production side, so that the cart comes into the room without touching the gowning path.
- Personnel flow: Unclassified corridor → gowning (iso 8) → airlock (ISO 7) → production (ISO 5–7).
- Material flow: Receiving → wipe-down / pass-through → staging → production without sharing doors with personnel gowning.
- Airflow: Introduce clean airflow into the cleanest area while venting back through the most contaminated part, so the pressure gradient will always be clean through less clean.
Human Factors: Hidden Load to Cleanroom Performance
While the engineering drawings will most probably omit the most significant contaminating variable in any cleanroom — the people. The sitting operator produces around 100,000 (0.3 micron) particles per minute only; once the operator starts walking, the rate jumps significantly. The overall behavior style with gowning, moving and working determines if the airflow is designed correctly or not — if the air changes happen or not.
That is why Deiiang™ considers the gowning protocol to be an input design solution rather than just an operational process. The gowning room sizes, the location of the benches, mirrors and airflow will have to ensure that all operators get dressed in the right order (coverall, hood, mask, gloves, boots). If the environment is so that following the proper sequence is an easy procedure, that solves the problem.
The rule of thumb is that each extra operator in ISO 7 will call for roughly 5–8% more airflow to cover particle load. If you are designing the premises for six operators and have ten in work, the facility will fail the pressure test before it fails the particle count.
Quantifying Space Efficiency
The Deiiang project employed modular technology to create a 1,850-square-meter shell in which the clean area amounted to 1,312 square meters, representing a net-to-gross ratio of 70.9 percent against the industry average rate for comparable stick-built ISO 7 buildings of 62 percent.
Its calculation is simple:
Net-to-gross ratio = usable clean area ÷ total building area
In particular, 1,312 ÷ 1,850 = 0.709. The figure is higher by 8.9 points due to space lost to interstitial areas which would have been otherwise occupied due to the ducted system.
Pressure Cascade and Classification
Classification is a gradient rather than a text. Each pair of rooms has to maintain pressure differential. There must be sufficient value to overcome door opening turbulence and not too high in order not to overspend on HVAC fan energy.
| Room | ISO Class | Pressure Differential with Neighboring Room (Pa) | Typical air changes per hour | Typical FFU Coverage |
|---|---|---|---|---|
| Production Core | ISO 5 | +10 to +15 | 240–480 | 60–100% |
| Production | ISO 6 | +10 to +15 | 90–180 | 30–50% |
| Production / Staging | ISO 7 | +5 to +10 | 30–60 | 15–25% |
| Gowning / Airlock | ISO 8 | +5 | 15–25 | 5–10% |
| Unclassified Corridor | — | Reference | 4–8 | 0% |
| Room | Production Core |
|---|---|
| ISO Class | ISO 5 |
| Pressure Differential | +10 to +15 Pa |
| Typical ACH | 240–480 |
| FFU Coverage | 60–100% |
| Room | Production |
| ISO Class | ISO 6 |
| Pressure Differential | +10 to +15 Pa |
| Typical ACH | 90–180 |
| FFU Coverage | 30–50% |
| Room | Production / Staging |
| ISO Class | ISO 7 |
| Pressure Differential | +5 to +10 Pa |
| Typical ACH | 30–60 |
| FFU Coverage | 15–25% |
| Room | Gowning / Airlock |
| ISO Class | ISO 8 |
| Pressure Differential | +5 Pa |
| Typical ACH | 15–25 |
| FFU Coverage | 5–10% |
| Room | Unclassified Corridor |
| ISO Class | — |
| Pressure Differential | Reference |
| Typical ACH | 4–8 |
| FFU Coverage | 0% |
Table 1 — Classification gradient and pressure cascade for a typical modular suite. Values are design targets; iso 14644-4 requires verification by measurement, not by assumption.
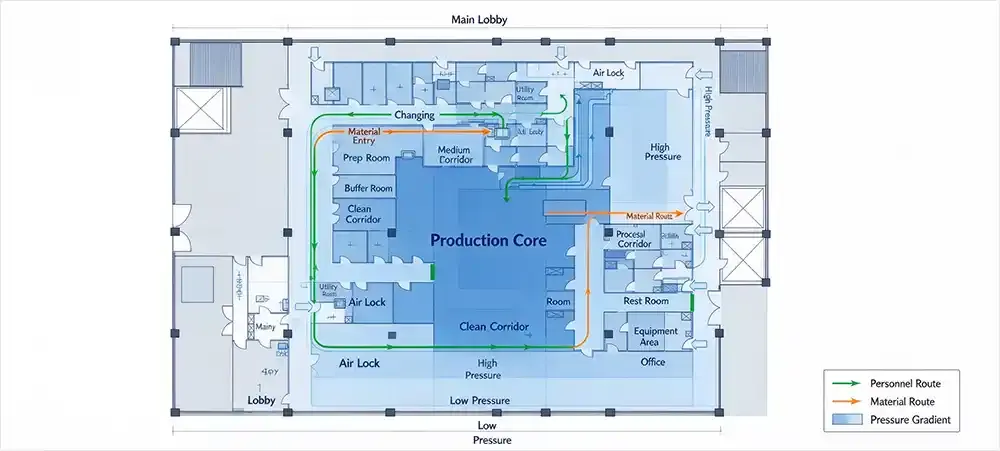
Typical cleanroom site plan illustrating separate personnel and material routes with pressure falling down from the production core.
Design Review: If your layout design entails the passage of a cart through the gowning area, the design is faulty, as no HEPA system can rectify the problem. You have to correct your design instead of increasing the number of HEPA systems.
HVAC System Design for Modular Units
The fundamental difference in modular cleanroom HVAC system design is that the equipment to manage the air is part of the module, rather than a structure. It means that duct runs will be shorter, plenums shallower, and the system has to be considered as a packaged and pre-manufactured system, not a network system manufactured on the construction site. Time advantage is significant while careless design leads to a system unable to hold pressure when the door is opened.
The three questions which will extensively define the result are: how air is delivered in the room, how pressure is controlled between rooms, and how much air is required at all. All three questions directly answer the modular cleanroom FFU system design questions.
Air Distribution Strategy
Air delivery in a modular cleanroom usually is a combination of FFUs, suspended from the ceiling and low-level air return. The goal is to create unidirectional airflow in the critical zone.
The supply air volume is set by the required air change rate:
Q = ACH × V, where Q is supply airflow (m³/h), ACH is air changes per hour, and V is room volume (m³).
The volume of a ISO 7 room that has an area of 100 m² and the height of 3 m can be calculated by the formula V = 300 m³. The flow rate of air can be determined with the help of the following equation Q = 40 × 300 = 12,000 m³/h. This is the flow rate that will aid in working out the fans, ducts and filters for the space.
LEAD ENGINEER'S NOTE — Jason.peng
"According to the project experience of the lead engineer Jason.peng, the most challenging job in the engineering field is always something else and not a new one, in the particular case, it's retrofitting an old facility. While carrying out engineering work in an old building, the workers usually have to deal with the low ceiling of up to 3 meters, airflow balancing, depths of the plenum and availability of the equipment in the area that was not constructed with the knowledge of a cleanroom."
Pressure Cascade Management
Setting up a modular system usually allows keeping the pressure cascade in place due to the controllable balance between airflow to and from the room. It should be mentioned that a room is positive when airflow inside exceeds the return flow. Air that enters the room gets leaked through doors and openings. The modular system is able to manage the system using variable speed fans on the supplying side and motorized dampers in the return airflow system. The differences in pressure at boundaries in the modular system are controlled through the use of pressure sensors that continuously log the process.
- Variable-speed fans on the supply side, trimmed per room.
- Motorized return dampers that adjust to hold the target ΔP.
- Differential pressure sensors at every classification boundary, logged continuously.
- Door-position interlocks that temporarily boost supply when a door opens.
Fig. 3 — Pressure cascade ladder. All measurements must be accurate and last at least 30 seconds.
Temperature, Humidity and Return Path Selection
Generally, modular units do not need the same kind of precision as semiconductor fabrication facilities. However, pharmaceutical, optical and similar processes need to be controlled better than regular industrial facilities. The following table shows the setpoints that we use as our default setpoints adjusted to respective processes.
| Application | Temperature | Relative humidity | Return air path | Comment |
|---|---|---|---|---|
| Pharma, GMP sterile | 18–22 °C | 45 ± 5% RH | Low side wall air grilles | Humidity is critical for some hygroscopic powders. |
| Precision optics assembly | 22 ± 1 °C | 45 ± 5% RH | Raised floor or low wall | Temperature control is necessary to prevent thermal drift. |
| Electronics, PCB | 22 ± 2 °C | 45 ± 10% RH | Low wall air grilles | Adjustable humidity system prevents ESD. |
| Medical device packaging | 20–24 °C | 30–60% RH | Ceiling return air | Wider ranges can be tolerated for sealed products. |
| Application | Pharma, GMP sterile |
|---|---|
| Temperature | 18–22 °C |
| Relative humidity | 45 ± 5% RH |
| Return air path | Low side wall air grilles |
| Comment | Humidity is critical for some hygroscopic powders. |
| Application | Precision optics assembly |
| Temperature | 22 ± 1 °C |
| Relative humidity | 45 ± 5% RH |
| Return air path | Raised floor or low wall |
| Comment | Temperature control is necessary to prevent thermal drift. |
| Application | Electronics, PCB |
| Temperature | 22 ± 2 °C |
| Relative humidity | 45 ± 10% RH |
| Return air path | Low wall air grilles |
| Comment | Adjustable humidity system prevents ESD. |
| Application | Medical device packaging |
| Temperature | 20–24 °C |
| Relative humidity | 30–60% RH |
| Return air path | Ceiling return air |
| Comment | Wider ranges can be tolerated for sealed products. |
Table 2 — Standard HVAC settings according to the type of installation. Deiiang™ validates each parameter based on client process heat load.
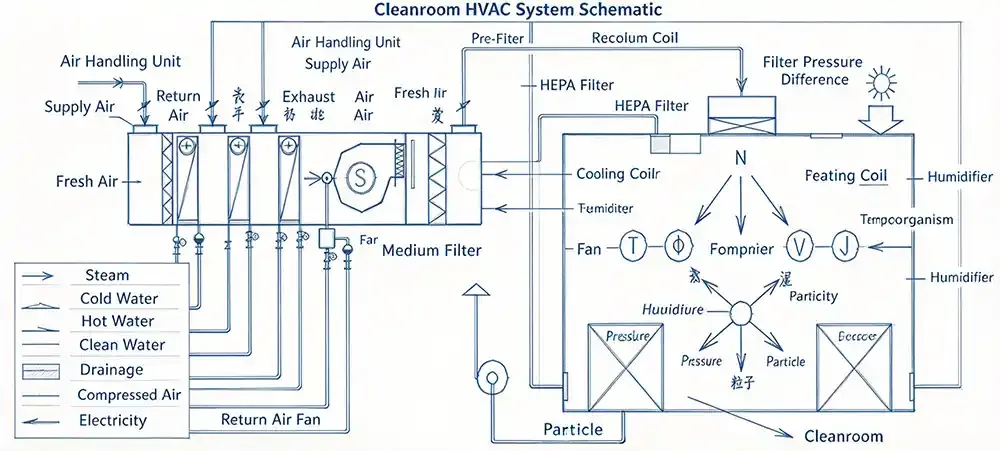
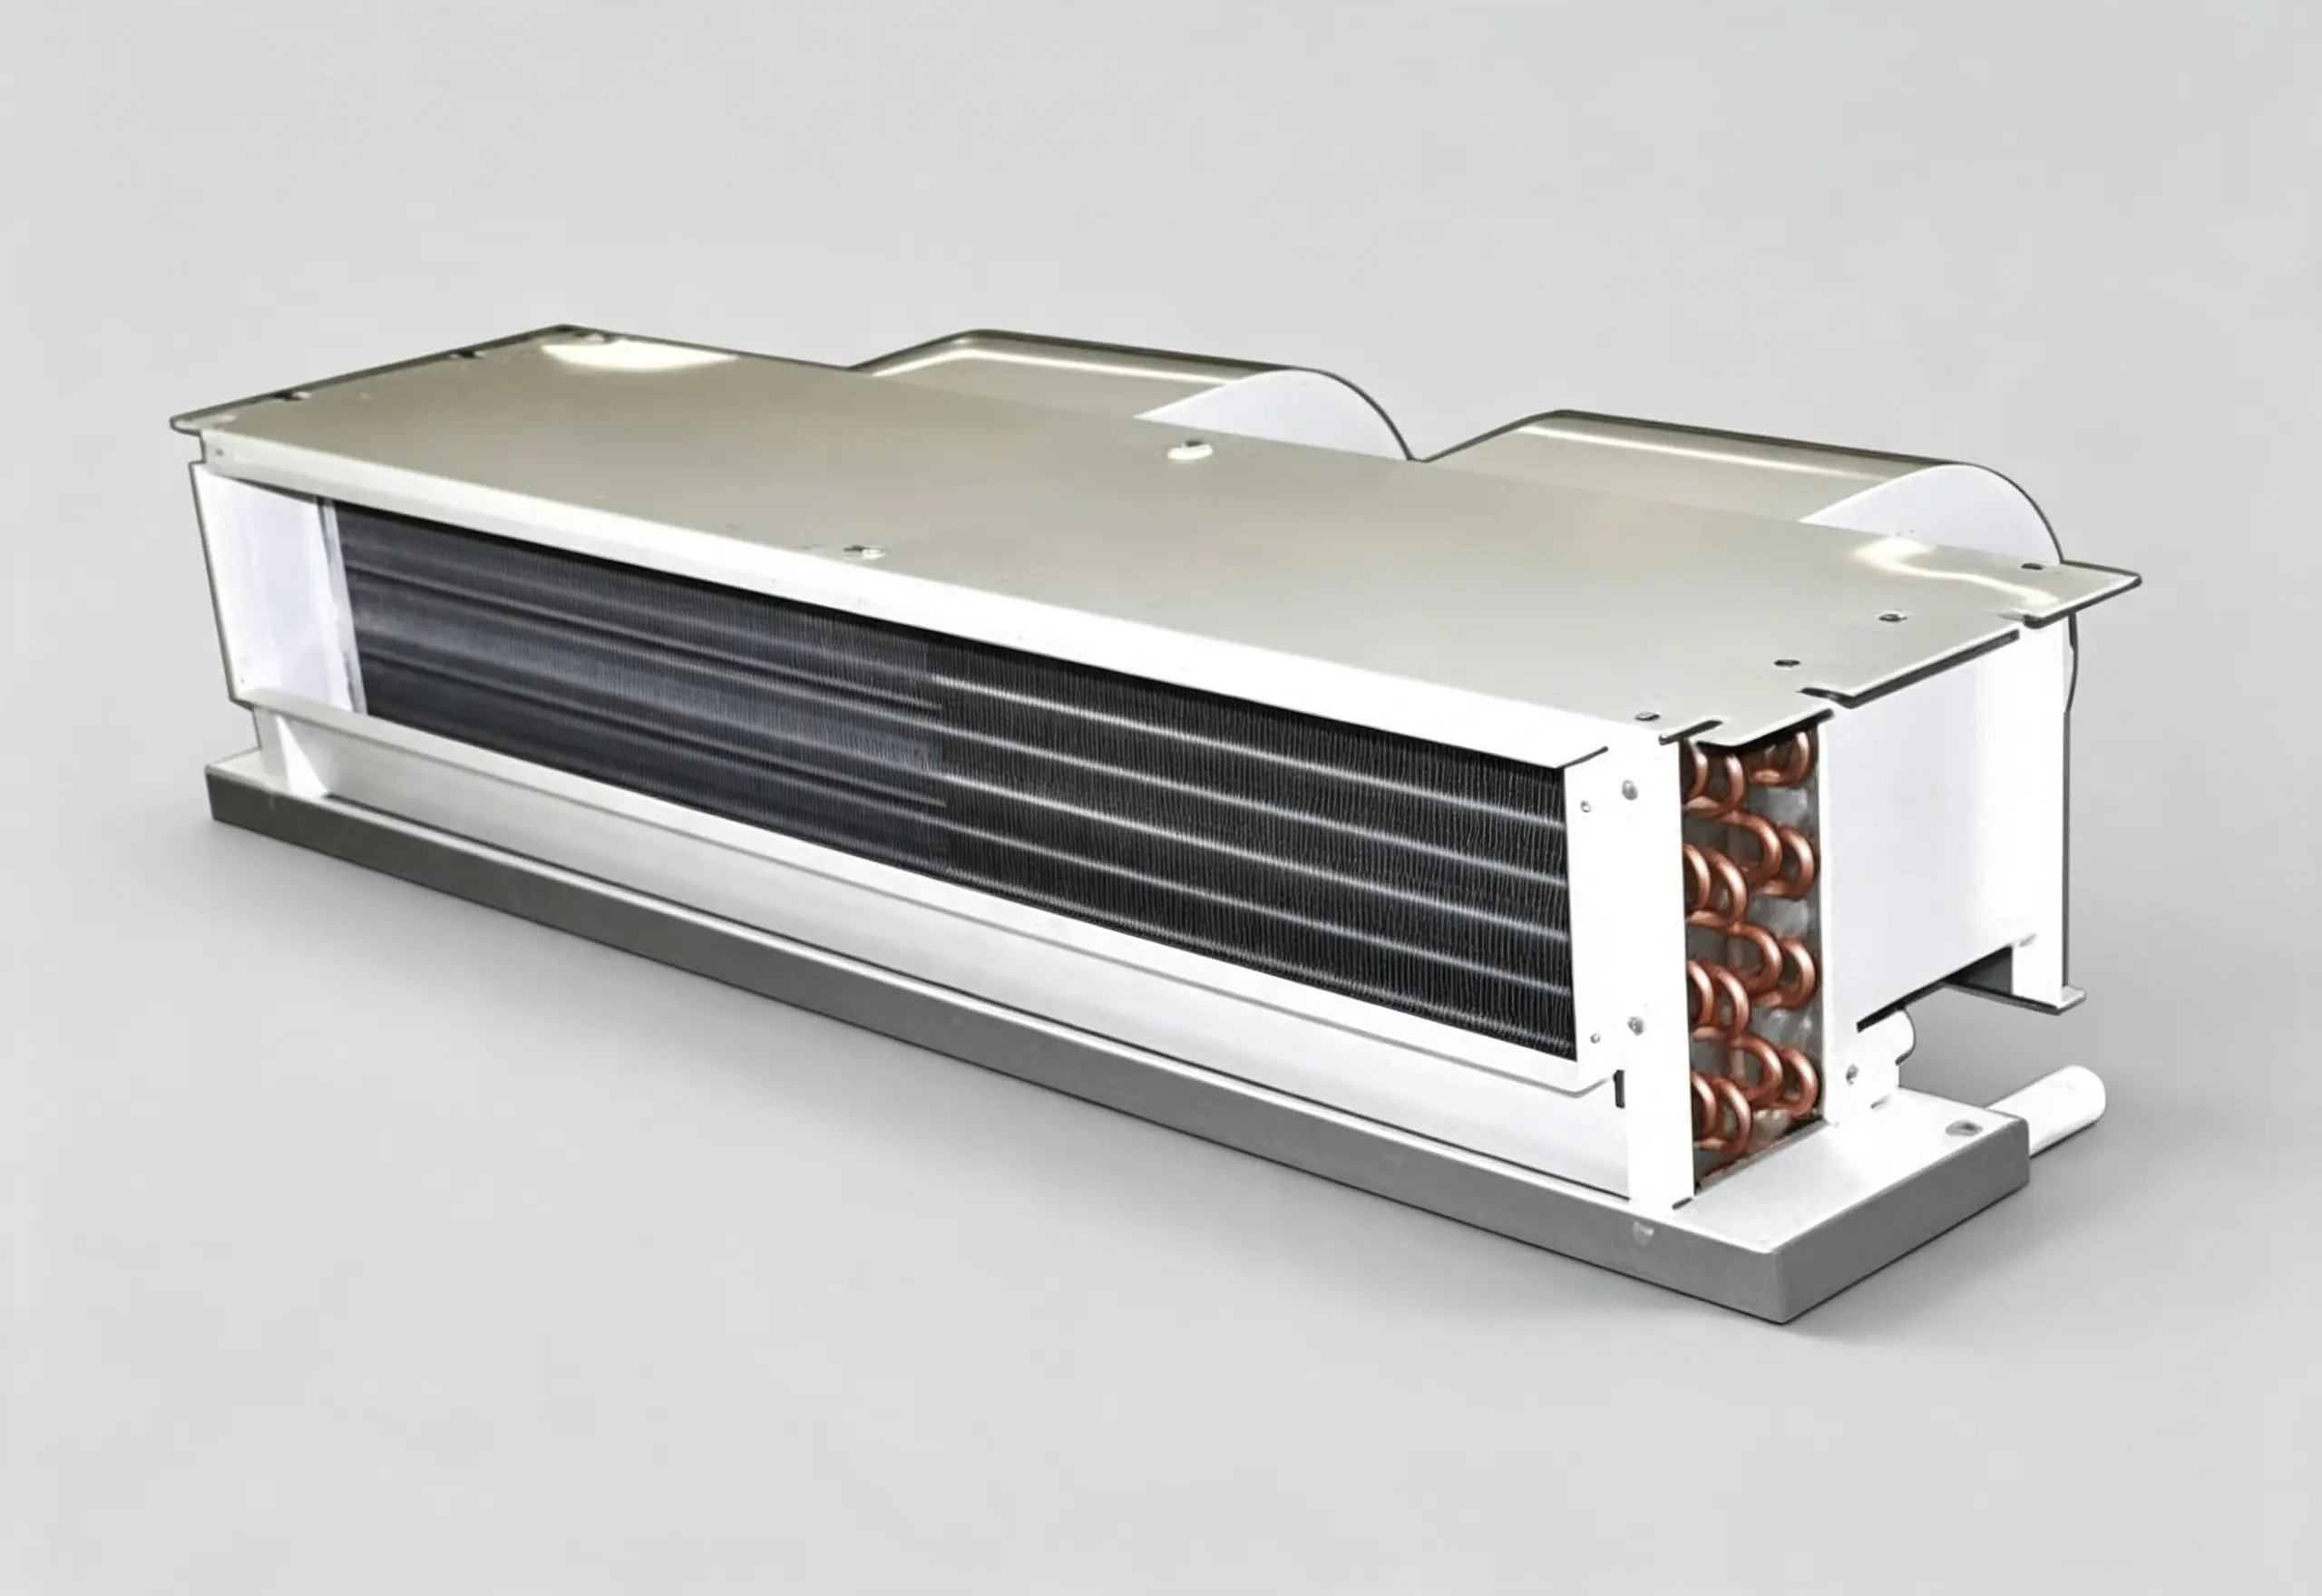
Design of HVAC system in modular unit.
Energy note: According to the energy statistics indicated by Deiiang experiments, reducing air exchange from 60 to 45 units caused a decrease of fan energy consumption by 27% while preserving unchanged the number of particles greater than 0.5 μm.
FFU Placement & Airflow Dynamics
The way of properly constructing the modular cleanroom FFUs is often neglected by the field specialists. Instead, they calculate the number of the units based on the area of the cleanroom ceiling. It is not correct as using this method will give either an over- or an under-filtered ceiling depending on the number of the units that can make the design invalid. The proper design involves determining how much airflow is necessary and transforming it into the number of FFUs required by calculating the actual airflow velocities and filter area.
Calculating the coverage ratio is a good way to check whether the number of unit matches the required standard. It provides an overall idea about the efficiencies of the number of FFUs being put into one place.
Calculating the Coverage Ratio and the Number of FFUs
The calculations are quite simple. If we consider a domestic FFU and assume that its size is 1200×600 mm at the face velocity of 0.35 m/s then:
Airflow per FFU = 1.2 m × 0.6 m × 0.35 m/s × 3600 s/h = 907 m³/h
In case of a 100 m² room being iso 7 cleanroom which would require 12,000 m³/h, so we can calculate the number of FFUs needed in the following way:
FFU count = 12,000 ÷ 907 ≈ 13.2 → 14 units
Total FFU footprint = 14 × 0.72 m² = 10.1 m². The coverage ratio = 10.1 ÷ 100 = 10.1%, which sits comfortably inside the 8–15% band that ISO 7 modules typically need when downflow is well organized.
Interactive Estimator: Airflow & FFU Count
Cleanroom Airflow & FFU Estimator
Fig. 5 — Consider this estimate to double-check your calculations. It isn’t final since FFU counts must be validated with the help of CFD or physical airflow tests.
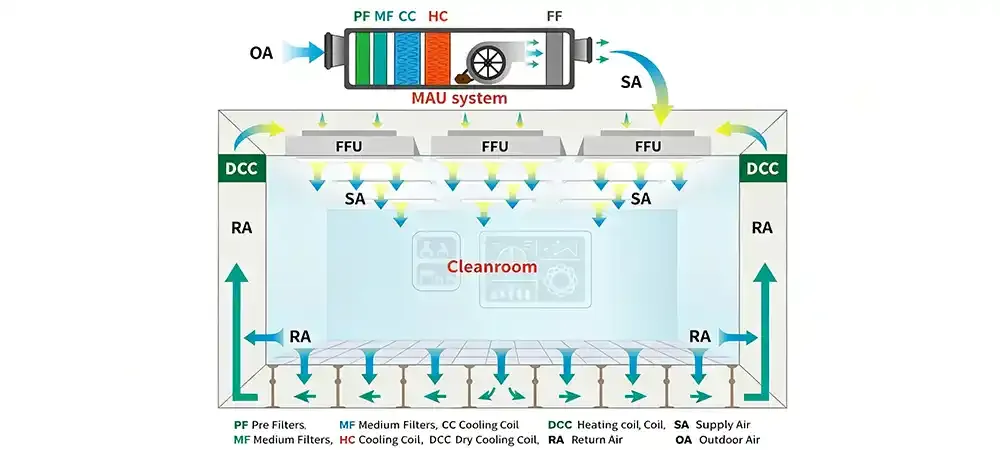
Comparison of FFU Layouts: 50% versus 20%
The table shows two designs of the same 100 m² ISO 7 module: a fundamentally conservative version of 50% of coverage and CFD-optimized version of 20% of coverage. Both designs meet ISO 7 particle limits; however, only one is cost-efficient.
| Parameter | Conservative FFU 50% coverage | Optimized FFU 20% coverage | Difference |
|---|---|---|---|
| The number of FFUs (1200×600 mm) | 69 units | 28 units | −59% |
| Total airflow | 62,583 m³/h | 25,396 m³/h | −59% |
| Efficiency of ACH | 209 | 85 | −59% |
| Installed power of fans | 7.6 kW | 3.1 kW | −59% |
| Annual power consumption of fans (8,760 h) | 66,576 kWh | 27,156 kWh | −59% |
| Validated particle count | Pass | Pass | Equivalent |
| Parameter | Conservative FFU 50% coverage |
|---|---|
| Number of FFUs | 69 units |
| Total airflow | 62,583 m³/h |
| Efficiency of ACH | 209 |
| Installed power of fans | 7.6 kW |
| Annual power consumption | 66,576 kWh |
| Validated particle count | Pass |
| Parameter | Optimized FFU 20% coverage |
| Number of FFUs | 28 units |
| Total airflow | 25,396 m³/h |
| Efficiency of ACH | 85 |
| Installed power of fans | 3.1 kW |
| Annual power consumption | 27,156 kWh |
| Validated particle count | Pass |
Table 3 — Comparison of two FFU designs in a cleanroom iso 7 setting: both pass the validation, and the optimized grid is 59% more energy efficient than the conservative one.
FFU Coverage in ISO 5 (use target of 60–100%)
FFU Coverage in ISO 6 (use target of 30–50%)
FFU Coverage in ISO 7 (use target of 15–25%)
FFU Coverage in ISO 8 (use target of 5–10%)
Fig. 6 — Distribution of FFUs by cleanroom classification standards.
Placement Patterns That Actually Work
Count is only half the problem; position is the other half. Users who place FFUs based on purely theoretical means create poorly functioning cleanrooms filled with dead spaces above the working space and exhausted returns located on the walls. Deiiang™ developed four rules regarding placement in this kind of modular system:
- Start with critical spaces. Place the FFUs in the area of active phases of the process as opposed to distributing them randomly across the entire ceiling.
- Align FFUs according to return flows. Supply and return should be stacked when possible, so the air will travel short and predictable paths.
- Maintain a distance of 300–600 mm from the wall. FFU placement close to the wall will create edge eddies without improving working zones.
- Group FFUs in switchable zones. The four-zone strategy will allow the facility to operate with diminished airflow during non-production time resulting in energy savings of 40–55%.
Deiiang Case Study: Retrofitting a High-Tech Cleanroom
Clean room theory is always neat; retrofit process is rather complicated. The case demonstrates how the whole task of designing modular cleanroom layout, HVAC system, and FFU installation was accomplished simultaneously under strict deadlines.
Project Introduction
A manufacturer of precise optics required an ISO 7 cleanroom with the floor area of 480 m² prepared for lens assembling and alignment purposes. The potential cleanroom was located in a facility with a ceiling height of 2.8 m thus making impossible the use of a traditional ducted air handling system without adjusting the structure. The completion period was limited to 48 hours.
The Constraints
- Available ceiling height: 2.8 m — a traditional air duct system would take away 1.1 m.
- Shutdown window: 48 hours with heavy fines for further delays.
- Existing chiller capacity: 180 kW. Already running at 70% load.
- Classification of the target: It is an ISO 7 standard when in operational condition. The process verifies compliance with ISO 14644-1.
Deiiang's Proposal
The composed HVAC system made by Deiiang™ is composed of ceiling-based elements functioning together as one unit. The FFU framework and exhaust system are put together before beginning to be installed at the construction site. The need to use ducting in the halls was fully eliminated and the assembly work was nearly restricted to connection and assembly of the system.
- Floor plan: In the presented solution three zones — ISO 8 dressing room, ISO 7 staging zone, ISO 7 assembly zone — are involved. The hall is equipped with isolated airlock for materials.
- HVAC: The hall has ceiling-mounted plenum operated by 350 mm systems and using independent chiller 120 kW capable of cooling rather than being connected to the existing cooling system.
- FFUs: 112 1200×600 mm units working in 4 different groups are delivering air into the room with ceiling coverage of 21 percent.
- Validation: Counting of particles with sizes 0.3 μm and 0.5 μm, as well as verification of pressure jump were accomplished.
Results
| Metric | Target | Achieved |
|---|---|---|
| Production downtime | ≤ 48 hours | 42 hours |
| Plenum depth used | ≤ 400 mm | 350 mm |
| Pressure cascade stability | ±3 Pa | ±2.4 Pa |
| ISO 7 particle count (0.5 μm) | ≤ 352,000 /m³ | 138,000 /m³ |
| Fan power at full operation | ≤ 14 kW | 11.4 kW |
| Estimated 10-year energy saving | — | ~34% vs. ducted baseline |
| Metric | Production downtime |
|---|---|
| Target | ≤ 48 hours |
| Achieved | 42 hours |
| Metric | Plenum depth used |
| Target | ≤ 400 mm |
| Achieved | 350 mm |
| Metric | Pressure cascade stability |
| Target | ±3 Pa |
| Achieved | ±2.4 Pa |
| Metric | ISO 7 particle count (0.5 μm) |
| Target | ≤ 352,000 /m³ |
| Achieved | 138,000 /m³ |
| Metric | Fan power at full operation |
| Target | ≤ 14 kW |
| Achieved | 11.4 kW |
| Metric | Estimated 10-year energy saving |
| Target | — |
| Achieved | ~34% vs. ducted baseline |
Table 4 — Measured performance after commissioning. Design and validation by Deiiang™, lead product designer Jason.peng.

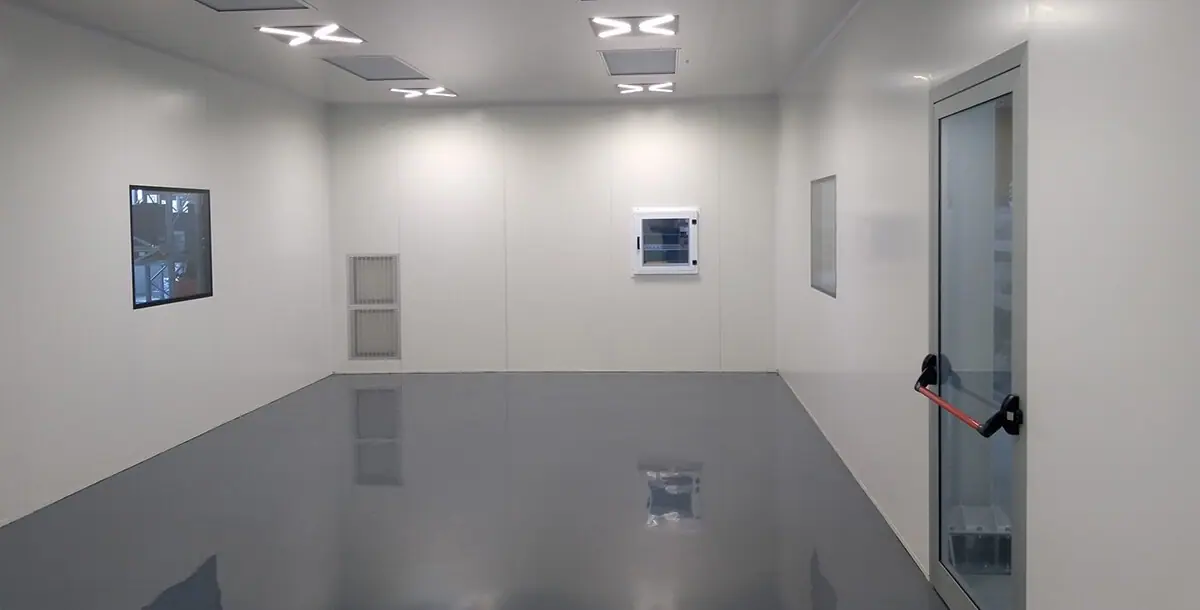
Before and after images of the multifunctional cleanroom created by Deiiang.
Common Misconceptions
Most cleanroom budgets are exceeded due to a few design beliefs that seem plausible but fail when tested. Here are the top four beliefs that come into play during modular cleanroom projects.
MYTH 1
"More Air Changes per Hour is Better."
Truth: ACH is a tool, not an objective. According to Deiiang data, proper air distribution and correct terminal filter placement can maintain the same ISO classification with 20% less of the air changes, thus also saving energy costs. Doubling the ambient ACH does not double cleanliness but instead doubles fan energy and filter usage.
DEIIANG ENGINEER'S FIELD NOTES
"At one time we had a customer who was trying to increase the ACH in ISO 7 area from 45 to 90, convinced that it would improve the performance. The result was the opposite: the velocity of air at the desk became sufficient for creating turbulence and bringing particles back into the critical area. The performance went down for three weeks until the air distribution was fixed. The lesson learned is that ACH should not be pursued — its distribution should be. A properly organized 40 ACH room will always outperform a poorly built 90 ACH room."
MYTH 2
"FFUs should occupy 100% of the ceiling for ISO 7."
Truth: CFD simulations and physical tests clearly demonstrate that optimized ISO 7 layout ensures compliance with 15–25% ceiling occupancy. Needing 100% ceiling occupancy may increase the FFU amount by three or even four times without having ensured compliance with cleanliness standards.
MYTH 3
"Modular means disposable."
Reality: New modern modular cleanroom structures constructed with powder-coated steel or aluminium frame and HPL wall panels have an average lifetime of around 20 years; all individual panels and fan filter units (FFUs) are effortlessly replaceable without dismantling the room. In fact, modularity is a maintenance asset and not a penalty in terms of its lifetime.
MYTH 4
"Cleanroom classification is defined merely by the filtration system."
Reality: The layout design, i.e. how well the layout makes possible the elimination of outside contamination and makes the flow of the staff, is also decisive. An improperly designed room, which is equipped with first-class filters, will still be incapable of performing since the point of contamination lies in the traffic scheme, rather than in the supply air.
Micro-Glossary
Here are four definitions of the terms which are being used in modular cleanroom design, HVAC and FFU specifications.
- Laminar flow (unidirectional air flow): Air movement in a uniform direction at a definite velocity, about 0.35–0.55 m/s for minimizing turbulence and preventing any particles to settle on the important surfaces of the cleanroom.
- HEPA filtration: High efficiency particulate air filtration of 99.97% of efficiency for particles of diameter of 0.3 μm — the minimum requirement for supply air for ISO classes 5 to 8.
- Pressure cascade: A difference in pressure in adjacent cleanrooms that compels air to move from cleaner zone to less clean one and prevents reverse flow of contamination during the periods of doors opening.
- FFU coverage ratio: Percentage of ceiling area occupied by fan filter units, used as a primary indication of acceptable ISO class and expected energy consumption of the fan.
Pre-Design Checklist
Designate specifics for both cleanroom operations and cleanroom at rest conditions based on ISO 14644-1.
Personnel flow and material flow mapping needs to be done before determining the walls of the cleanroom.
Obtain room volume and needed air supply flow rate.
Set pressure cascade system and communication of pressure measuring devices.
Design FFU grid based on airflow rather than ceiling area.
Set FFUs into groups for easy operation.
Pre-planning the overall validation protocol prior to the cleanroom installation is essential.
Operations, Compliance & Audit Readiness
It is clear that the importance of a good design is limited to how well it achieves compliance. The nature of the cleanroom layout, the HVAC/FFU decisions taken during the design phase may make the compliance checks and environmental monitoring extremely easy or vice versa.
The costs spent on validation and environmental monitoring on annual basis would be 15–25% more for those facilities which consider compliance issues after the cleanroom is delivered.
mJ1UTewzmj4
Three Monitoring Parameters That Must Be Designed In
With Deiiang™ these features are supposed to be deemed as design outcomes, instead of something that is added by the validation contractor:
- Continuous monitoring of particles: There has to be at least one real-time particle counter present per critical area and installed in close proximity to the process, meaning that it has to be put not on the wall that is furthest away from the work. The 0.5 μm channel needs to be recorded at a frequency that will permit identifying any changes during one shift.
- Pressure alarm thresholds: Each of the classification boundaries has to have sensors with a specified alarm range — usually its value will be ±2 Pa from the set point manufacturer of the device. The alarm has to be recorded and not displayed only.
- Forecast of filter loading and replacement: Each bank of FFU has to be either equipped with devices or manually assessed so that the changes in parameters across HEPA filter can be seen. When the filter will reach the pressure drop limit during the work, it will require an emergency stoppage; however, this issue can be avoided with the help of monitoring data.
How the Design Solutions Help Cut the Costs
The most important advantage of complying the requirements is that the system will automatically collect necessary information. When HVAC set points and values of the rooms are controlled by one management system it means that information can be processed automatically making the revalidation easier. The method that was utilized in the design of the new Deiiang project has reduced the workload for completing the annual internal audit by more than sixty hours per year. This means an enormous saving of operations costs which is not displayed in the long-term financial plans of the project, but rather registered in operational logs each year.
The following table illustrates the link between the compliance benefits obtained in the process of the development of the design of the new project and the obligations needed to be undertaken.
| Design solution | Compliance benefit | Ongoing obligation |
|---|---|---|
| Different personnel and material airlocks | Minimizing cross-contamination at transition points | Verification of door interlocks, audit of gowning procedures. |
| Monitoring pressure inside rooms with sensors | Provides audit-ready pressure history | To account for sensor calibration every 6 to 12 months. |
| FFU being grouped into banks | Provides partial load operation without losing the classification | Airflow verification at the bank level after each change. |
| Continuous particle monitoring in critical zone | Allows detecting of drift before its conversion into nonconformance | Counter calibration and audit of data integrity. |
| Pressure gauges at FFU banks | Fully allows predictive filter change | Need to have trending review and filter change scheduling. |
| Design solution | Different personnel and material airlocks |
|---|---|
| Compliance benefit | Minimizing cross-contamination at transition points |
| Ongoing obligation | Verification of door interlocks, audit of gowning procedures. |
| Design solution | Monitoring pressure inside rooms with sensors |
| Compliance benefit | Provides audit-ready pressure history |
| Ongoing obligation | Sensor calibration every 6 to 12 months. |
| Design solution | FFU being grouped into banks |
| Compliance benefit | Provides partial load operation without losing classification |
| Ongoing obligation | Airflow verification at the bank level after each change. |
| Design solution | Continuous particle monitoring in critical zone |
| Compliance benefit | Allows detecting of drift before its conversion into nonconformance |
| Ongoing obligation | Counter calibration and audit of data integrity. |
| Design solution | Pressure gauges at FFU banks |
| Compliance benefit | Fully allows predictive filter change |
| Ongoing obligation | Need to have trending review and filter change scheduling. |
Table 5 — Design-to-compliance mapping. Each design solution requires an obligation in operation; the best designs limit these burdens as much as possible.
Conclusion & CTA
The success of the modular cleanroom design depends on the simultaneous development of layout, HVAC and air conditioning grid as one overall task. The layout determines the access points for contamination; HVAC specifies whether the pressure will be maintained; and FFU provides protection for the working zone. By optimizing the work done in all the processes together, it is possible to achieve the result.
The order of actions should not be overlooked. First, you need to establish a classification gradient, determine the airflow based on the volume of the cleanroom, position the FFUs only above the critical zone and validate the pressure thresholds based on the measurements. After that, the monitoring and compliance systems need to be integrated in a proper way and made part of the continuous process so that they would not have to be done every year separately. Organizations applying this method have lower chances of failing their ISO 14644 test than those using the device catalog.
If you wish to design a cleanroom in accordance with the space plans, ventilation and FFUs' construction, Deiiang™ offers complimentary design consultation service. Jason.peng, the chief designer at Deiiang will consider your floor plan, production process and target classification and then prepare the package with calculated airflow level, pressure changes, FFU placement scheme and monitoring plan.
Get in touch with Deiiang™ to book your free consultation.
References
- ISO 14644-1:2015 — Classification of air cleanliness by particle concentration
- ISO 14644-4:2022 — Design, construction and start-up of cleanrooms
- iso 14644-3:2019 — Test methods
- EU GMP Annex 1 — Manufacture of Sterile Medicinal Products
- IEST-RP-CC002 — Unidirectional Flow Clean-Air Devices
- ASHRAE Handbook — HVAC Applications, Clean Spaces
- Deiiang™ — Modular Cleanroom Systems and Engineering Data
Frequently Asked Questions
What is the first step in designing a modular cleanroom layout?
It’s necessary to determine the classification level as well as separate humans from product flow before the construction begins. Each subsequent solution, for example, with respect to the pressure cascade, HVAC design, and FFU placement depend entirely on these two factors. If the design assumes that carts and people will go through the same entrance, it will fail validation no matter how good the filtration system is.
How is airflow required for a modular cleanroom HVAC calculated?
It is calculated using the formula Q = ACH × V, where Q is airflow in cubic meters per hour, and ACH is air changes/hour of the particular ISO class. For example, a 100m² ISO 7 cleanroom with a 3.0-meter-high ceiling will have V = 300m³, and with 40 ACH the required air will equal 12,000 m³/h.
How many FFUs does an ISO 7 cleanroom require?
The total airflow divided by the capacity of one FFU gives the number of required devices. A regular 120 × 60 cm FFU with the air speed of 0.35 m/s provides around 900 m³/h of airflow, so 12,000 m³/h require around 14 devices. This is about 10% ceiling coverage which is quite normal for ISO 7.
Are 100% FFU coverage required?
Only for ISO 5 zones and the cleaner ones with full unidirectional airflow at the working surface. As for ISO 6, ISO 7 and iso 8 cleanrooms, the CFD optimized design may obtain validation with a 15–50% coverage amount of FFUs.
What is the time period required for a modular cleanroom retrofit?
For example, it took Deiiang™ 42 hours of production downtime to perform the ceiling-integrated retrofit within a 48-hour period for a 480m² cleanroom. The use of the off-site pre-assembly of both the clean room’s ceiling and its FFU system made it possible to complete the works in such a short period of time.