+86 13638632902
 Jason@cleanroomequips.com


 MENU
MENU
ICa Neue", Arial, "Noto Sans", sans-serif, "Apple Color Emoji", "Segoe UI Emoji", "Segoe UI Symbol", "Noto Color Emoji";">Most HVAC project engineers have felt the pain: a cooling tower that looks perfect on paper but fails when ambient humidity rises. The market is flooded with low-cost units where Cooling Tower Installation Requirements are ignored. Buyers often focus only on nominal tonnage, missing the fact that cheap towers routinely underperform by 20–30% in real conditions. This guide translates field traps into measurable, contract-ready checkpoints.
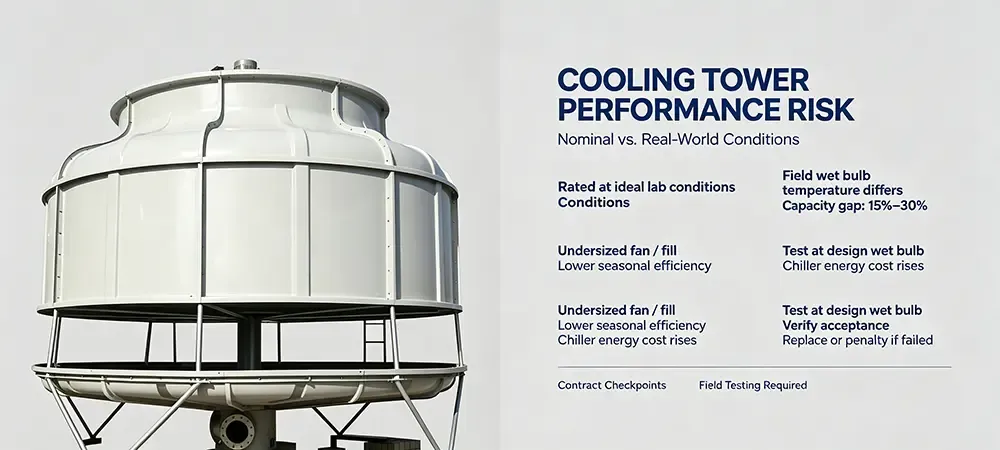
Three Major Cooling Tower Traps That Kill Performance
Understanding how manufacturers cut corners helps you write enforceable specifications. The following three patterns appear repeatedly in failed projects, and eACH can be detected before concrete is poured if you follow strict Cooling Tower Installation Guidelines.
TRAP 1Tonnage & water flow fraud
In addition to the normal 15-30% overdesign of low-cost tower capacity (e.g., 600 RT tower actually delivering about 470-480 RT), there is another very common cheat. That is, the tower is rated at 27°C DB (and zero fouling factor) whereas the actual site wet-bulb temperature is typically 1.5° to 2.5° higher, and there is 5% or so restriction in airflow, etc. As a result, the chiller high-pressure trips every summer afternoon.
TRAP 2Hidden component downgrades
Several critical dimensions are silently reduced. For example, while a cooling tower may be specified with 0.32 mm PVC fill, it may arrive with 0.28 mm thick fill and 20% less surface area than specified. The spray nozzles may be reduced from 48 to 36 pieces, resulting in very uneven water distribution. These changes violate the standard tolerances and alignment Requirements for cooling tower foundations and are generally not checked when the tower is received.
TRAP 3Template selection without climate adaptation
The typical tower is re-used across many applications including Data Center, Factory, Shopping Mall. The critical factor of recirculating hot air, dealing with freeze in winter, dealing with high humidity is totally ignored. For South China and many locations in Southeast Asia, the design wet-bulb temperature often exceeds 28°C. Thus, a typical tower’s capacity will be further reduced by 8% to 12% unless additional margin is taken.
“Buy for your site’s wet-bulb, not the brochure’s dream lab.”
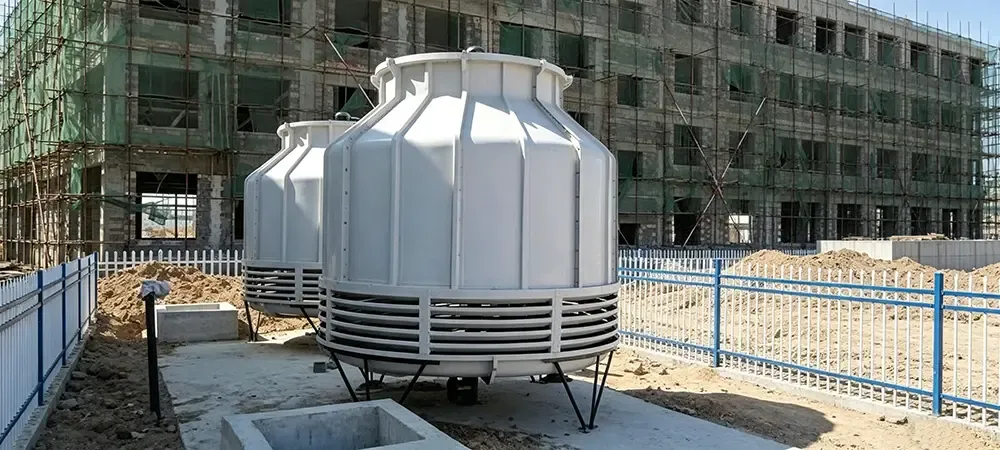
Minimum Data Set for Real-World Selection
Locking three numbers before signing a purchase order is essential in cooling tower procurement. These three numbers, actually three parameters, are key to a proper cooling tower installation and prevent a cooling tower from being oversizes on purpose.
Design wet-bulb temperature — Use local meteorological P1% value (e.g. 28.5°C for Dongguan instead of 27°C).
Water temperature entering and leaving the chiller & rated flow: typical water temp. 37°C–32°C; ΔT of chiller’s condenser load.
Degradation (8-12%) for piping resistance, fill aging, and recirculation of hot air.
Local Climate Data & Verification Methods
Real performance depends on location-specific design conditions. The table below compares wet-bulb values for three representative cities. Always reference ASHRAE or local weather bureau data; never accept a vendor’s generic assumption. This directly affects cooling tower installation guidelines for capacity testing.
| City | Summer design WB (P1%) | Suggested capacity margin | Data source |
|---|---|---|---|
| Guangzhou | 28.8°C | +12% | China meteorological station 10‑yr |
| Shanghai | 28.2°C | +10% | ASHRAE 2021 fundamentals |
| Bangkok | 29.4°C | +15% | Thai meteorological dept. |
Guangzhou
WB 28.8°C · margin +12%
China met station 10‑yr
WB 28.8°C · margin +12%
China met station 10‑yr
Shanghai
WB 28.2°C · margin +10%
ASHRAE 2021
WB 28.2°C · margin +10%
ASHRAE 2021
Bangkok
WB 29.4°C · margin +15%
Thai met dept.
WB 29.4°C · margin +15%
Thai met dept.
Wind environment check
Hot air recirculation can raise inlet wet-bulb by 1.5–2.5°C. Evaluate enclosure walls, louvers, and discharge clearance. A simple CFD or smoke test often reveals that discharge air re-enters the intake, violating basic cooling tower foundation tolerance for airflow separation.
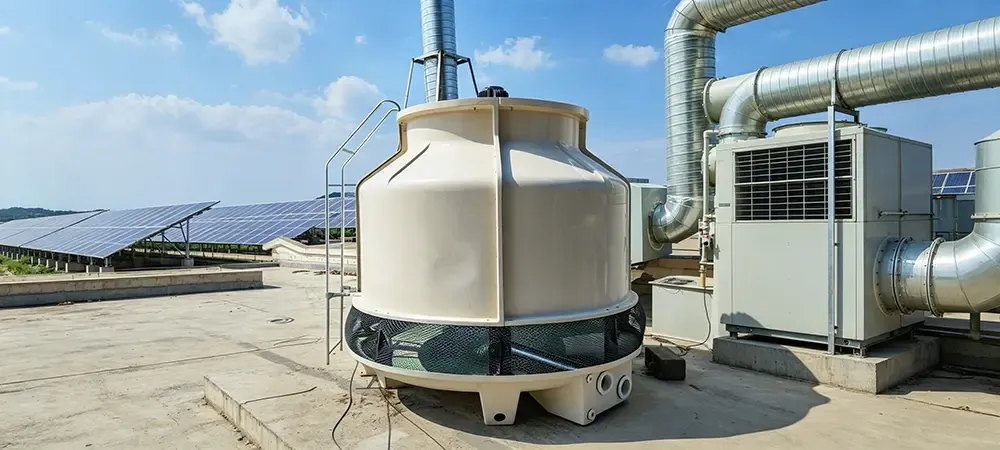
Receiving Inspection & Contract Clauses That Protect You
Verification at delivery is your last low-cost chance to catch fraud. Combine a physical checklist with a binding performance test. These steps turn vague promises into enforceable cooling tower installation requirements.
☑ On-arrival physical check
Fan diameter & motor kW (nameplate photo)
Fill thickness ≥ 0.32 mm, specific area ≥ 150 m²/m³
Nozzle count & spray pattern uniformity
Galvanized coating ≥ 275 g/m² (ASTM A123)
☑ Field capacity test protocol
Stabilize at design flow & heat load for 30 min
Measure inlet/outlet water temp, wet-bulb, flow rate
Calculate actual kW rejected; compare to spec
Pass criterion: ≥ 97% of rated capacity at site WB
Mandatory contract language: “Capacity shall be verified by on-site thermal test at design wet-bulb. If measured capacity falls below 95% of specified value, supplier shall replace or retrofit at no cost, plus penalty of 1.5% of contract value per percentage point shortfall.”
Energy Penalty & Lifecycle Cost Visualization
A cheap tower that raises condenser water temperature by just 1.5°C increases chiller compressor work by about 4–6%. Over 5 years, the extra electricity dwarfs any upfront saving. This is why real cooling tower installation guidelines always include energy modeling.
Expected capacity (100% = 600 RT at site WB)
Field-measured low-cost tower (typical)
Annual energy penalty example: A 500 RT chiller running 3,000 hours/year with 1.2°C higher condensing temperature adds ~58,000 kWh/year. At $0.12/kWh, that’s $6,960/year wasted — enough to pay for a proper tower in 3 years.
Deiiang™ Engineered Specifications (replace with verified data)
Every Deiiang™ tower is configured around site wet-bulb, not catalog fantasy. The table below shows how component choices directly support long-term cooling tower installation requirements and avoid the traps described above.
| Parameter | Deiiang™ typical | Low-cost trap tower |
|---|---|---|
| Certified capacity at site WB | 600 RT @ WB 28.5°C, ΔT 5°C | 600 RT @ WB 27°C (lab only) |
| Fan/motor | Ø 4,270 mm, 22 kW IE3 | Ø 3,800 mm, 18.5 kW IE1 |
| Fill specific area | ≥ 160 m²/m³, 0.32 mm PVC | ~125 m²/m³, 0.26 mm |
| Hot-dip galvanizing | ≥ 275 g/m² (ASTM A123) | often < 200 g/m² |
| Drift loss | ≤ 0.002% | 0.01–0.02% |
Capacity
Deiiang™: 600 RT @28.5°C
Trap: 600 RT @27°C lab
Deiiang™: 600 RT @28.5°C
Trap: 600 RT @27°C lab
Fan motor
Deiiang™: Ø4,270mm 22kW IE3
Trap: Ø3,800mm 18.5kW
Deiiang™: Ø4,270mm 22kW IE3
Trap: Ø3,800mm 18.5kW
Fill
Deiiang™: 160 m²/m³
Trap: ~125 m²/m³
Deiiang™: 160 m²/m³
Trap: ~125 m²/m³
Coating
Deiiang™: ≥275 g/m²
Trap: <200 g/m²
Deiiang™: ≥275 g/m²
Trap: <200 g/m²
Third-party test reports and certificates available for download (placeholder link). Noise level ≤ 78 dB(A) at 1 m, drift loss verified per CTI ATC-105.
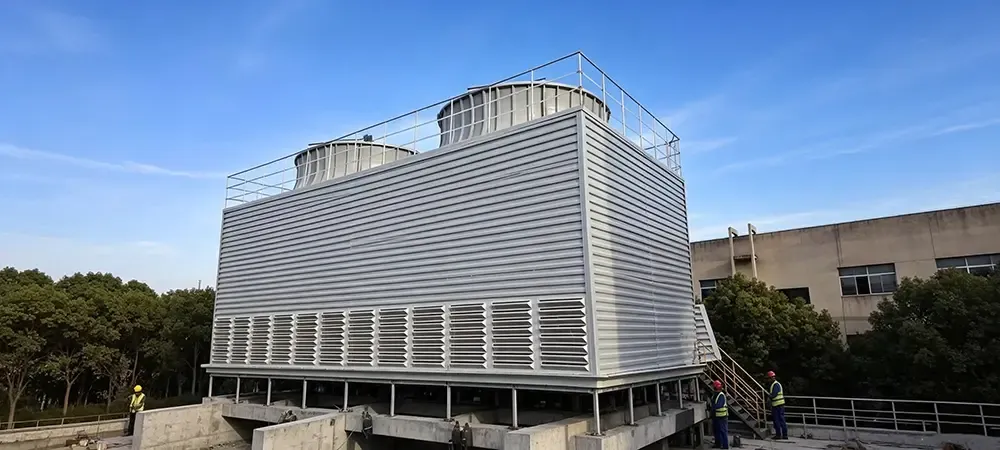
Deiiang™ Field Case: Dongguan Factory Retrofit
A plastICs factory in Dongguan suffered daily chiller trips with four existing 600 RT towers. Summer wet-bulb 28.7°C combined with poor discharge clearance caused discharge air to short-circuit back to intakes. The plant lost over 12 production days per year.
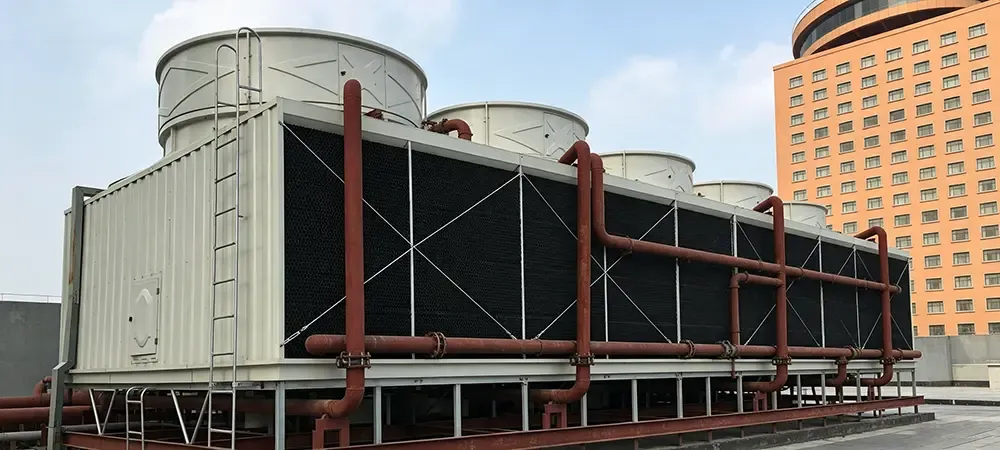
Solution by Jason.peng (Deiiang™): Replaced with 4 × 650 RT towers rated at WB 29°C, added discharge velocity cones and inlet louvers to eliminate recirculation. Fill thickness upgraded to 0.35 mm with edge-to-edge spray coverage. Acceptance test at 37°C→32°C confirmed 648 RT average.
Leaving water temperature dropped 3.8°C
Chiller high-pressure alarms reduced by 92%
Annual electricity saving 187,000 kWh
ROI achieved in 14 months
price Comparison Checklist: When the Gap Exceeds 20%
If two bids differ by more than 20%, the cheaper one almost certainly hides one of the traps above. Use this quick audit before issuing a PO. These checks connect directly to cooling tower installation guidelines and warranty validity.
Capacity test method defined (site WB, not lab)
Fan motor kW and diameter locked in submittal
Fill data: thickness, specific area, material grade
Galvanizing weight per ASTM A123
Spray nozzle quantity and distribution diagram
Contract clause: fail = replacement + penalty
Frequently Asked Questions
This answers are based on field experience for hundreds of audits for installation requirements of cooling towers in Asia.
Why does my tower meet nameplate tonnage but still cannot cool?
The cooling tower was designed at 27°C wet-bulb and 100% fill. Thus 28.5°C+ wet-bulb and some fouling reduces the capacity by 20–30%.
How to select the correct local design wet-bulb?
Use ASHRAE 0.4% or 1% evaporative design wet-bulb for your city. Never accept a vendor's default.
What does a field capacity test involve?
A field capacity test for a cooling tower involves measuring water flow, inlet and outlet temperatures and the ambient wet-bulb temperature under a stable load for a period of 30 minutes. From this data you can then calculate the amount of kW that has been rejected and compare this against the specified value.
Conclusion: Engineer Your Tower Around Reality
Cooling towers are the thermal gatekeepers of your chiller plant. A single-digit percentage drop in tower performance multiplies into thousands of dollars in wasted energy. Insist on cooling tower foundation tolerance checks, site-wet-bulb verification, and binding acceptance tests. Deiiang™ offers free工况复核 and on-site evaluation — contact our team to schedule a review before your next procurement.
References
ASHRAE Handbook — HVAC Systems and Equipment, Chapter 40, Cooling Towers
CTI ATC-105 — Acceptance Test Code for Water Cooling Towers
ASTM A123/A123M — Standard Specification for Zinc (Hot-Dip Galvanized) Coatings
China National Standard GB/T 7190.1 — Mechanical Draft Cooling Towers
© Deiiang™ · Product design: Jason.peng · All performance data must be verified with site-specific submittals.